Observability & Telemetry
Harness the information that is carried across K8s network traffic, to understand your cluster and measure its performance.
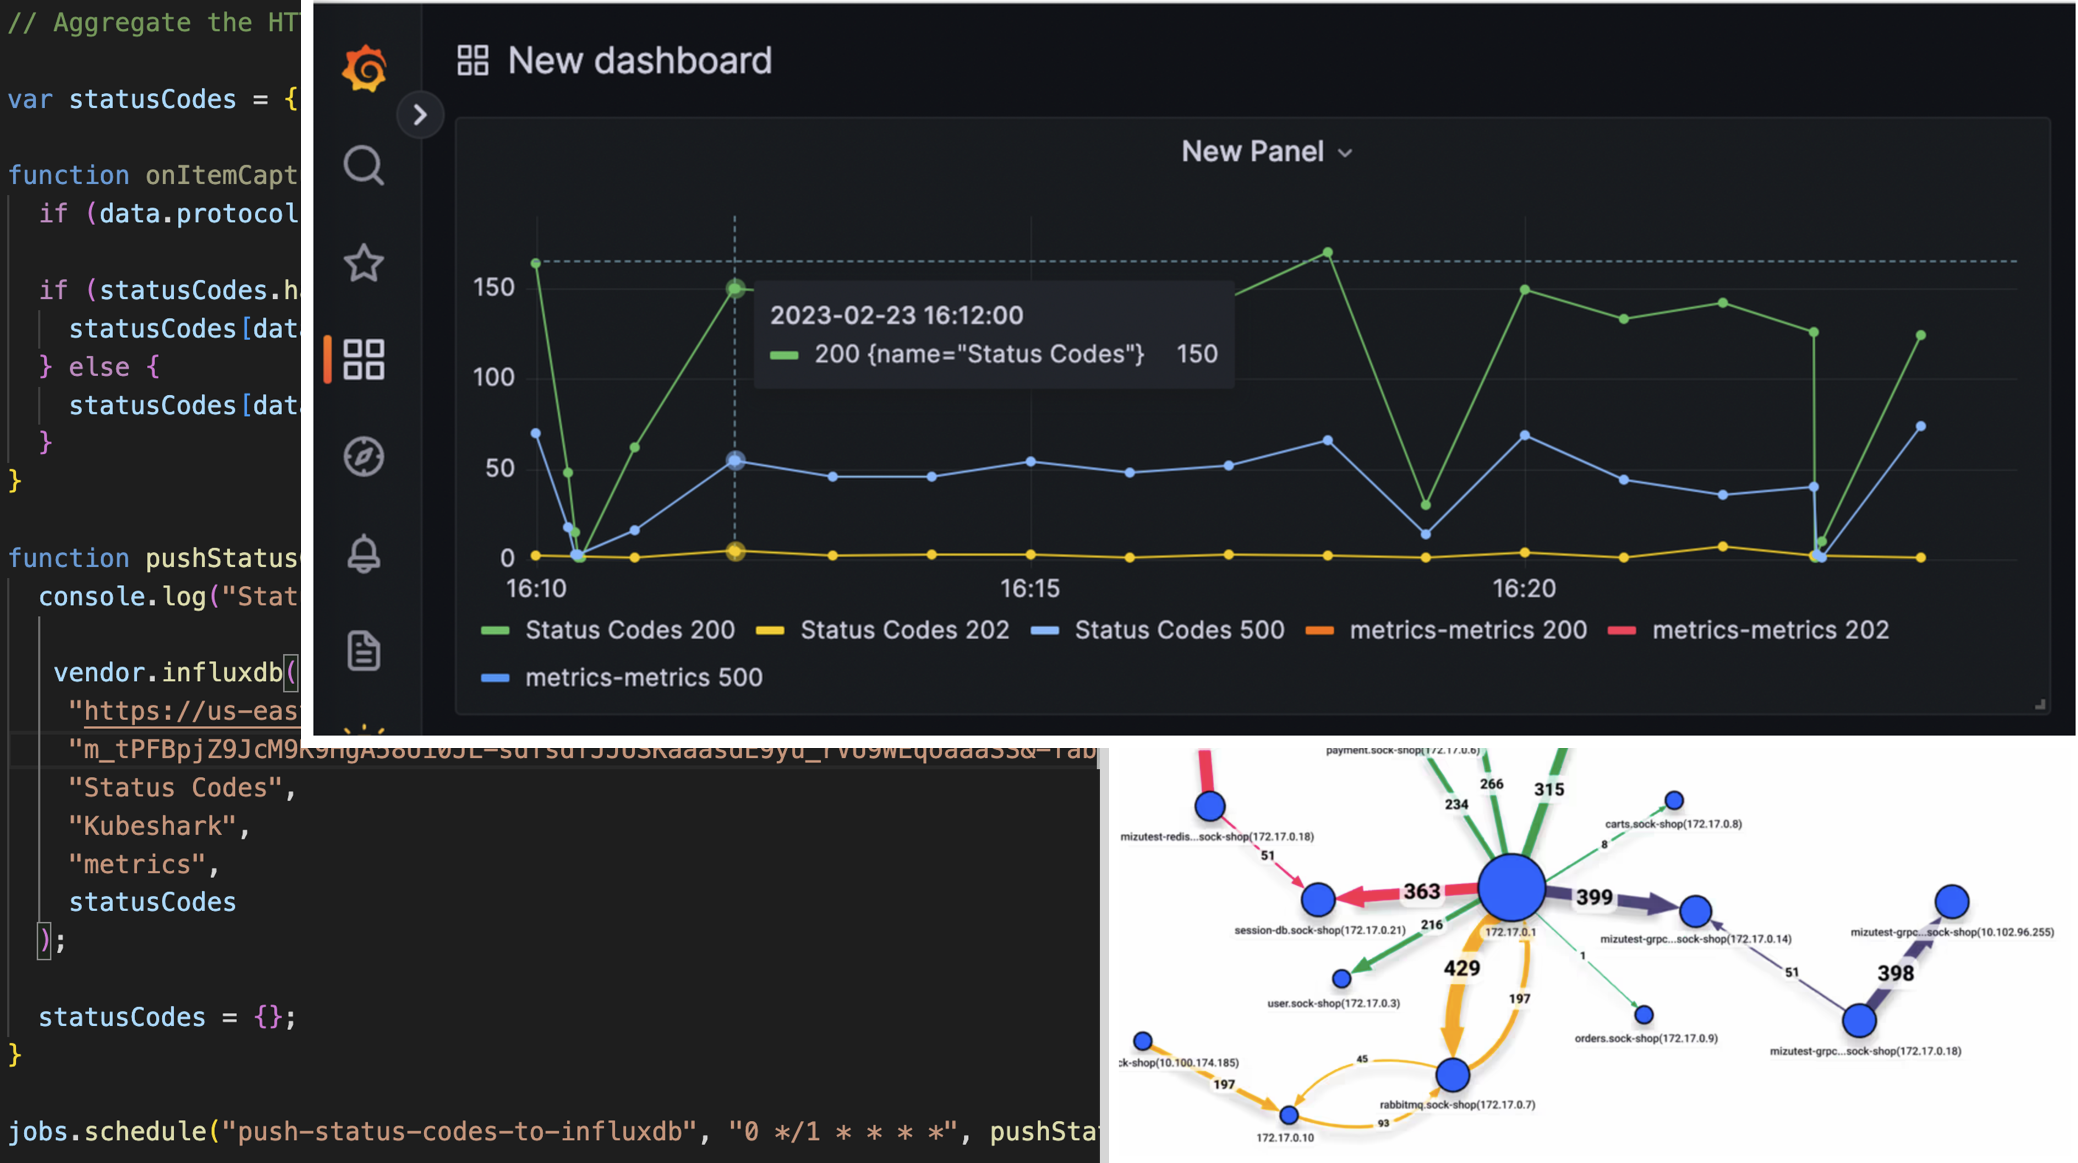
Workload Map
Understand your cluster and service dependencies with Kubeshark’s Workload Map.
Read more in the Workload Map section.
Metrics & Logs
Kubeshark enables you to send metrics and logs to your favorite telemetry or logs provider and enjoy dashboards and alerts.
Read more in the InfluxDB & Grafana and Elasticsearch sections.