L4/L7 Workload Map
Kubeshark offers two distinct workload maps accessible in the MAP tab, providing a comprehensive view of network interactions within your cluster.
- L4: Bandwidth, throughput, between workloads, cluster-wide
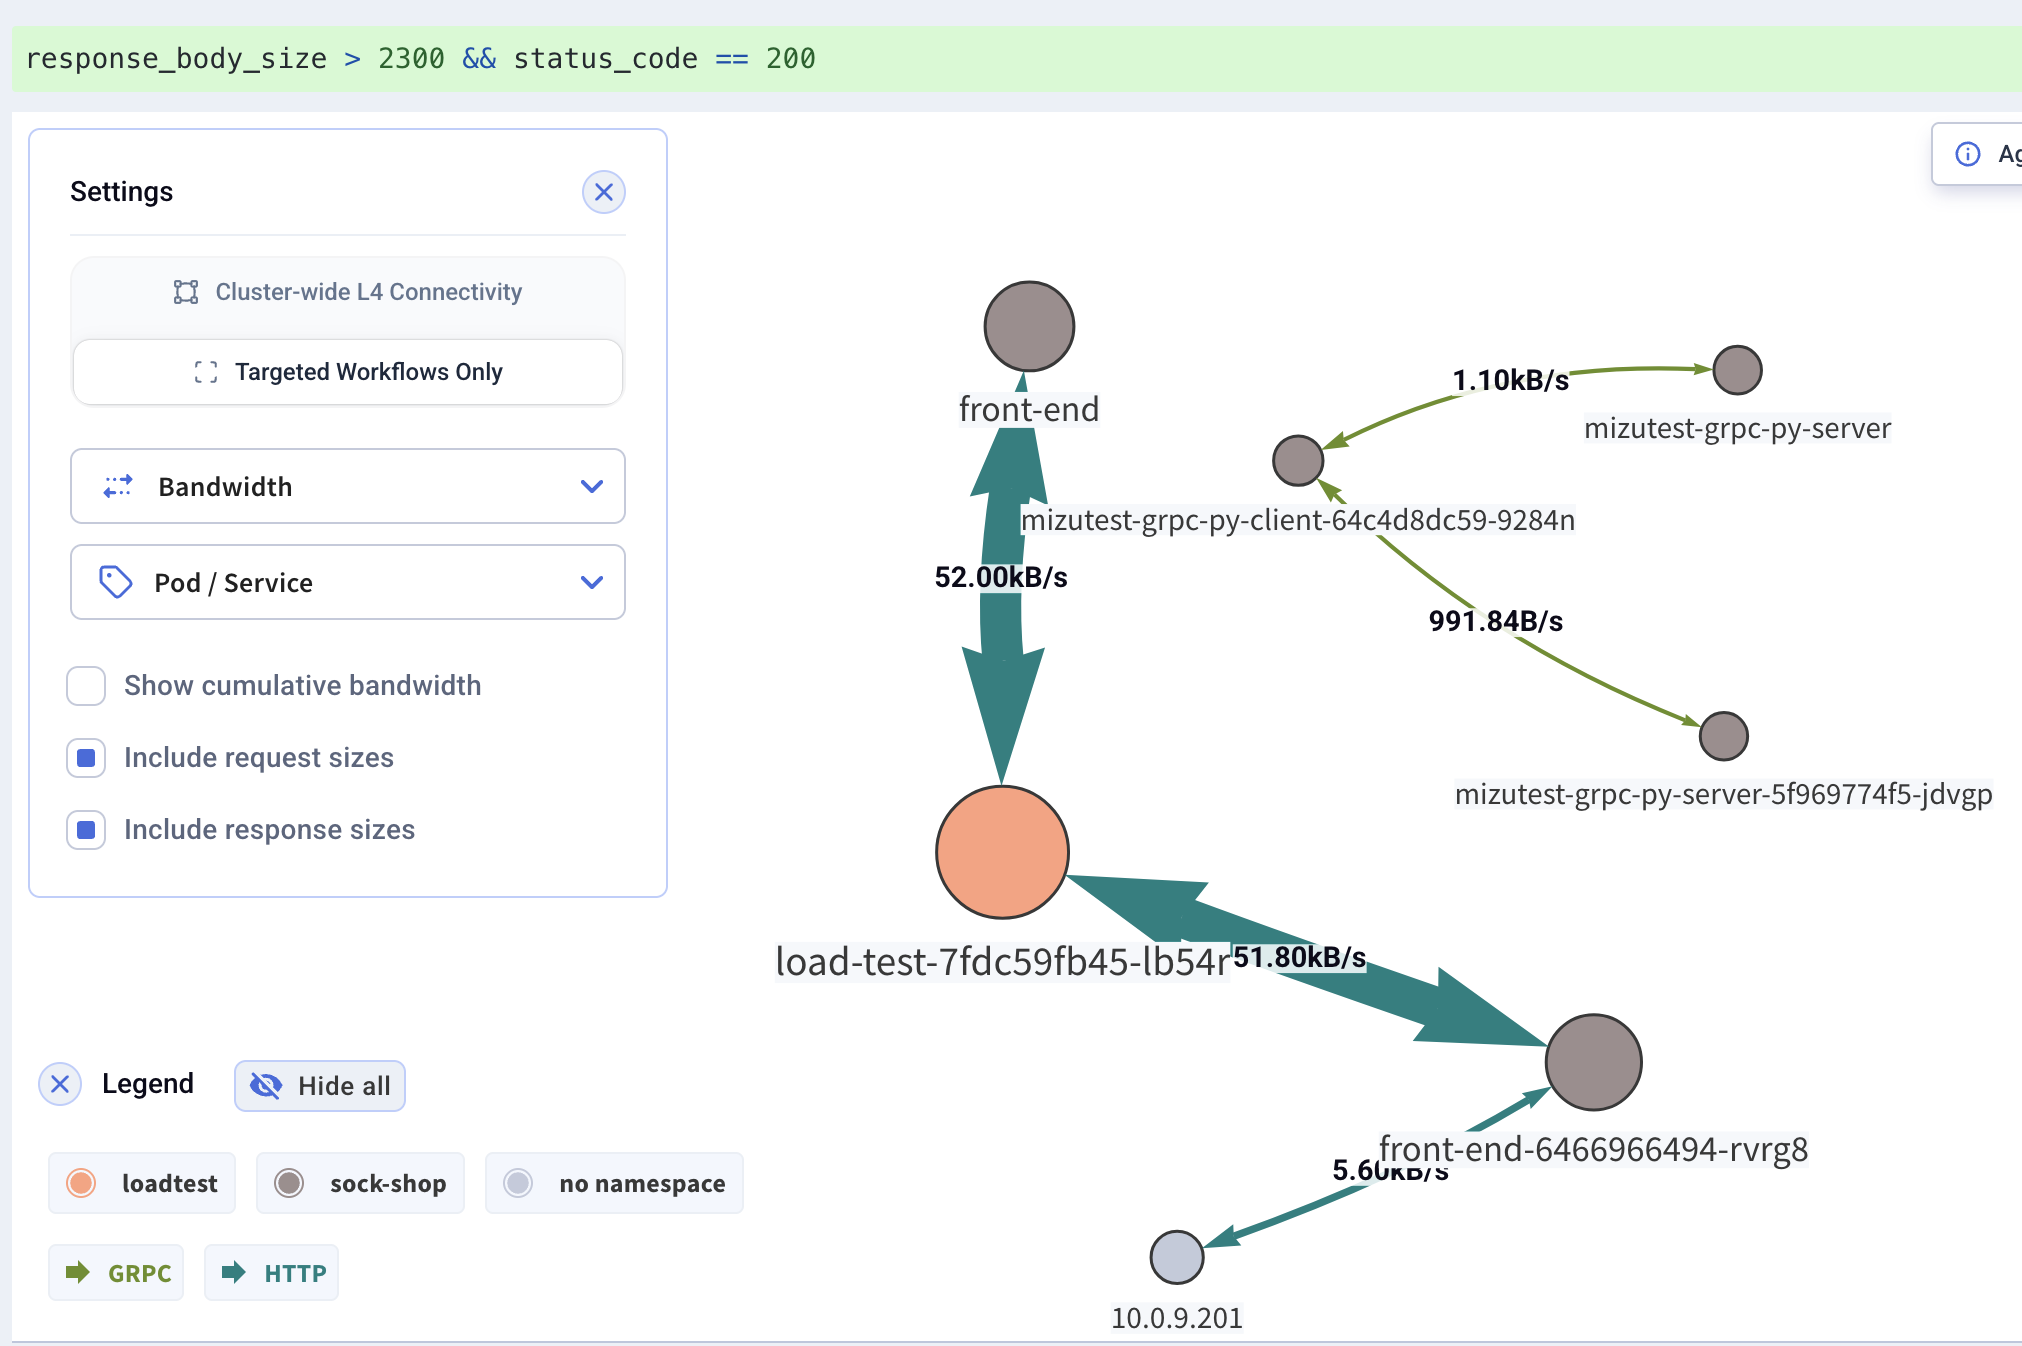
- L7: Bandwidth, protocols, between workloads, filtered in by both capture filters and kfl2
Map Types
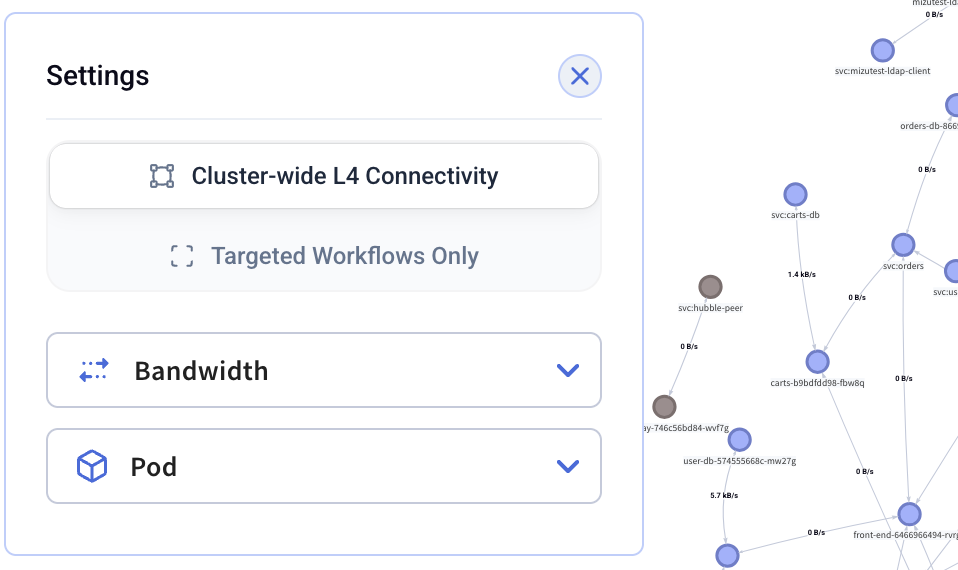
The map type can be selected from the Settings dialog:

L7: Targeted Workloads Only
An L7 map based on API dissection that shows only traffic and workloads that pass through both Capture Filters and Display Filters (KFL2). This map measures protocol-based L7 interactions and displays the protocol on each connection (e.g., HTTP, DNS, gRPC, Redis, Kafka).

Characteristics:
- Adheres to both Capture Filters and Display Filters
- Based on L7 API dissection (not L4)
- Only includes targeted workloads (not cluster-wide)
- Displays application-level protocols on connections (color-coded in legend)
Note: The bandwidth measurements shown on the L7 map are an aggregation of items streaming to the dashboard, calculated in the browser. These numbers do not reflect real-world bandwidth - they represent the aggregated size of items that reached the dashboard. For real-world bandwidth metrics, use the L4 Cluster-wide map.
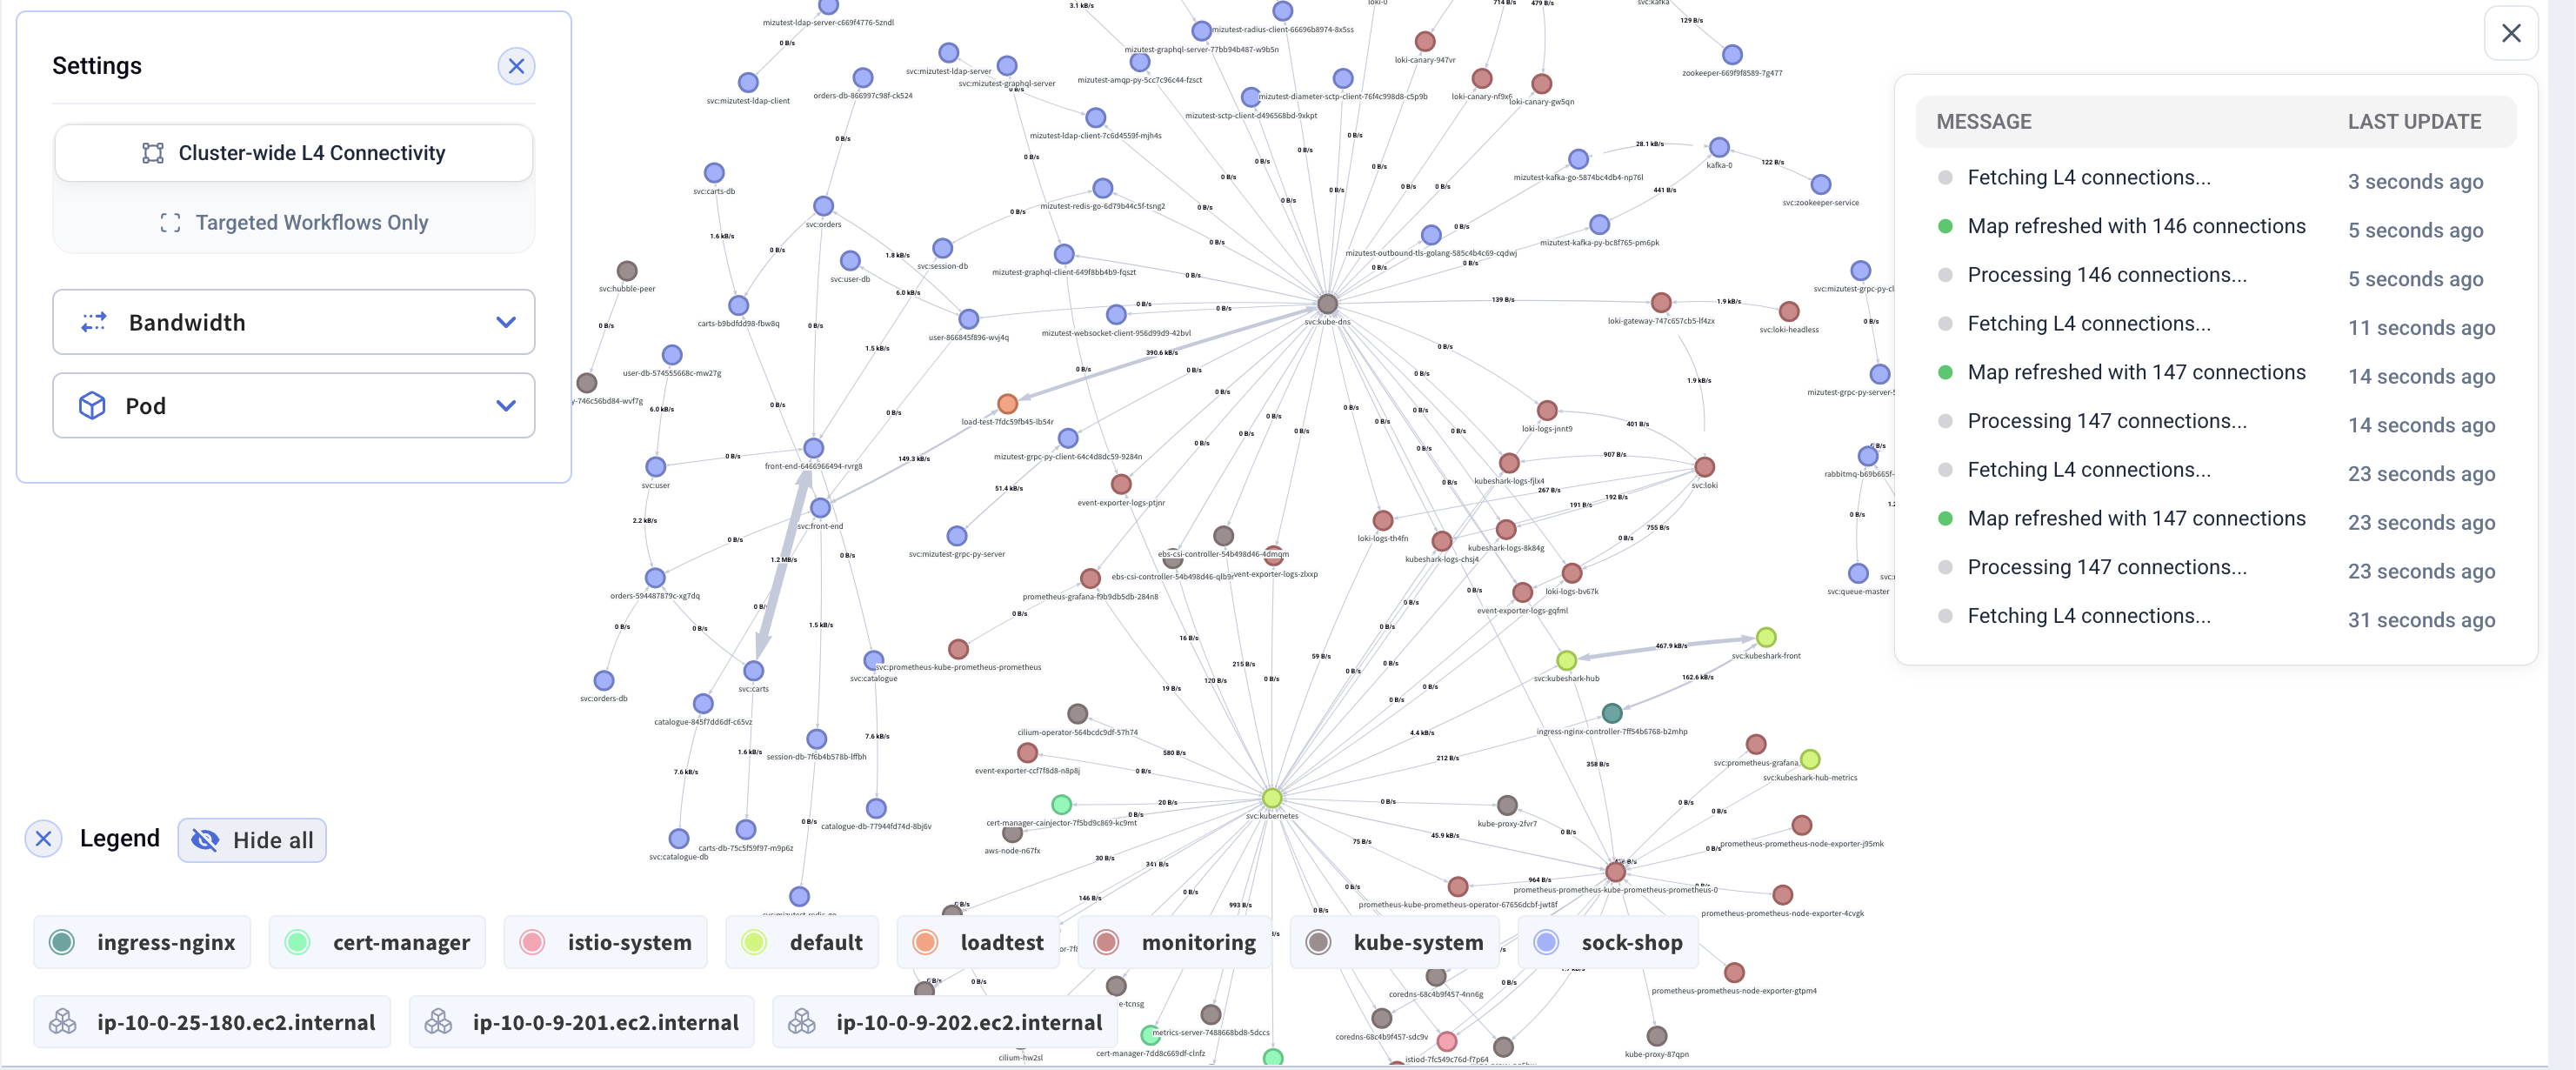
L4: Cluster-wide L4 Connectivity
Experimental feature. The L4 connectivity map is hidden by default and not yet optimized for large or busy clusters. To enable it, set the Helm value:
tap:
  dashboard:
    clusterWideMapEnabled: true
Shows all L4 (TCP/UDP) connections across the entire cluster, regardless of any filter rules. This map is created from information gathered at the node level, tracking all workloads and their egress and ingress connections on each node.

Characteristics:
- Shows everything regardless of Capture Filters or Display Filters
- Based on L4 traffic
- Displays real-world bandwidth and throughput metrics
- Egress and ingress bandwidth metrics
- Throughput (packets) metrics
Display Options
Additional display options are available in the Settings dialog:
Grouping
Each map can be grouped at different levels:
- Namespace - Group workloads by namespace
- Node - Group workloads by node
- Pod / Service - Show individual workload-level connections
Bandwidth Options
- Bandwidth - Toggle bandwidth metrics on connections
- Show cumulative bandwidth - Display cumulative bandwidth instead of rate
- Include request sizes - Include request sizes in bandwidth calculations
- Include response sizes - Include response sizes in bandwidth calculations
Focus on Specific Parts of the Cluster
Dense clusters can yield cluttered maps. With Kubeshark, you can zero in on particular sections of your cluster by:
- Using KFL2 display filters to filter traffic
- Using Legend Filters to show/hide specific namespaces or nodes
View Real-Time Changes
By default, the maps refresh in real-time, displaying changes inferred directly from incoming traffic.