Snapshots
The Snapshots panel provides access to Traffic Snapshots directly from the dashboard. Create new snapshots, browse existing ones, download PCAPs, and optionally run Delayed Indexing to make the snapshot queryable.
Creating Snapshots
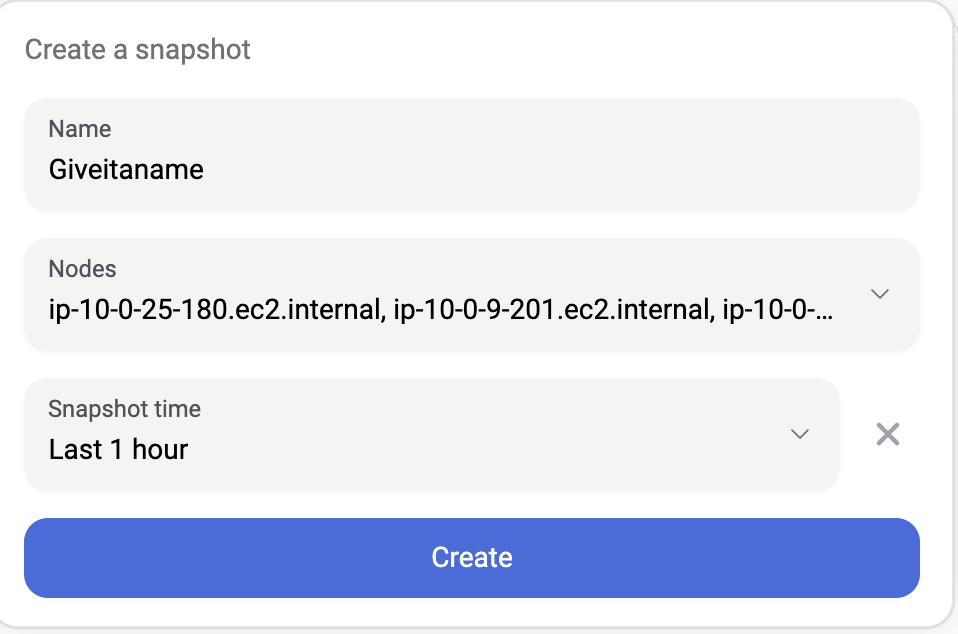
To create a new snapshot:
- Name — Enter a descriptive name (e.g.,
incident-2024-02-01,checkout-debug) - Nodes — Select all nodes or specific worker nodes to include
- Time Window — Select any start and end time within the available raw capture data using the date/time picker
- Click Create
The snapshot is extracted from Raw Capture buffers and moved to dedicated storage on the Hub. The time window can span from minutes to days — limited only by how much raw capture data is available.
PCAP Export
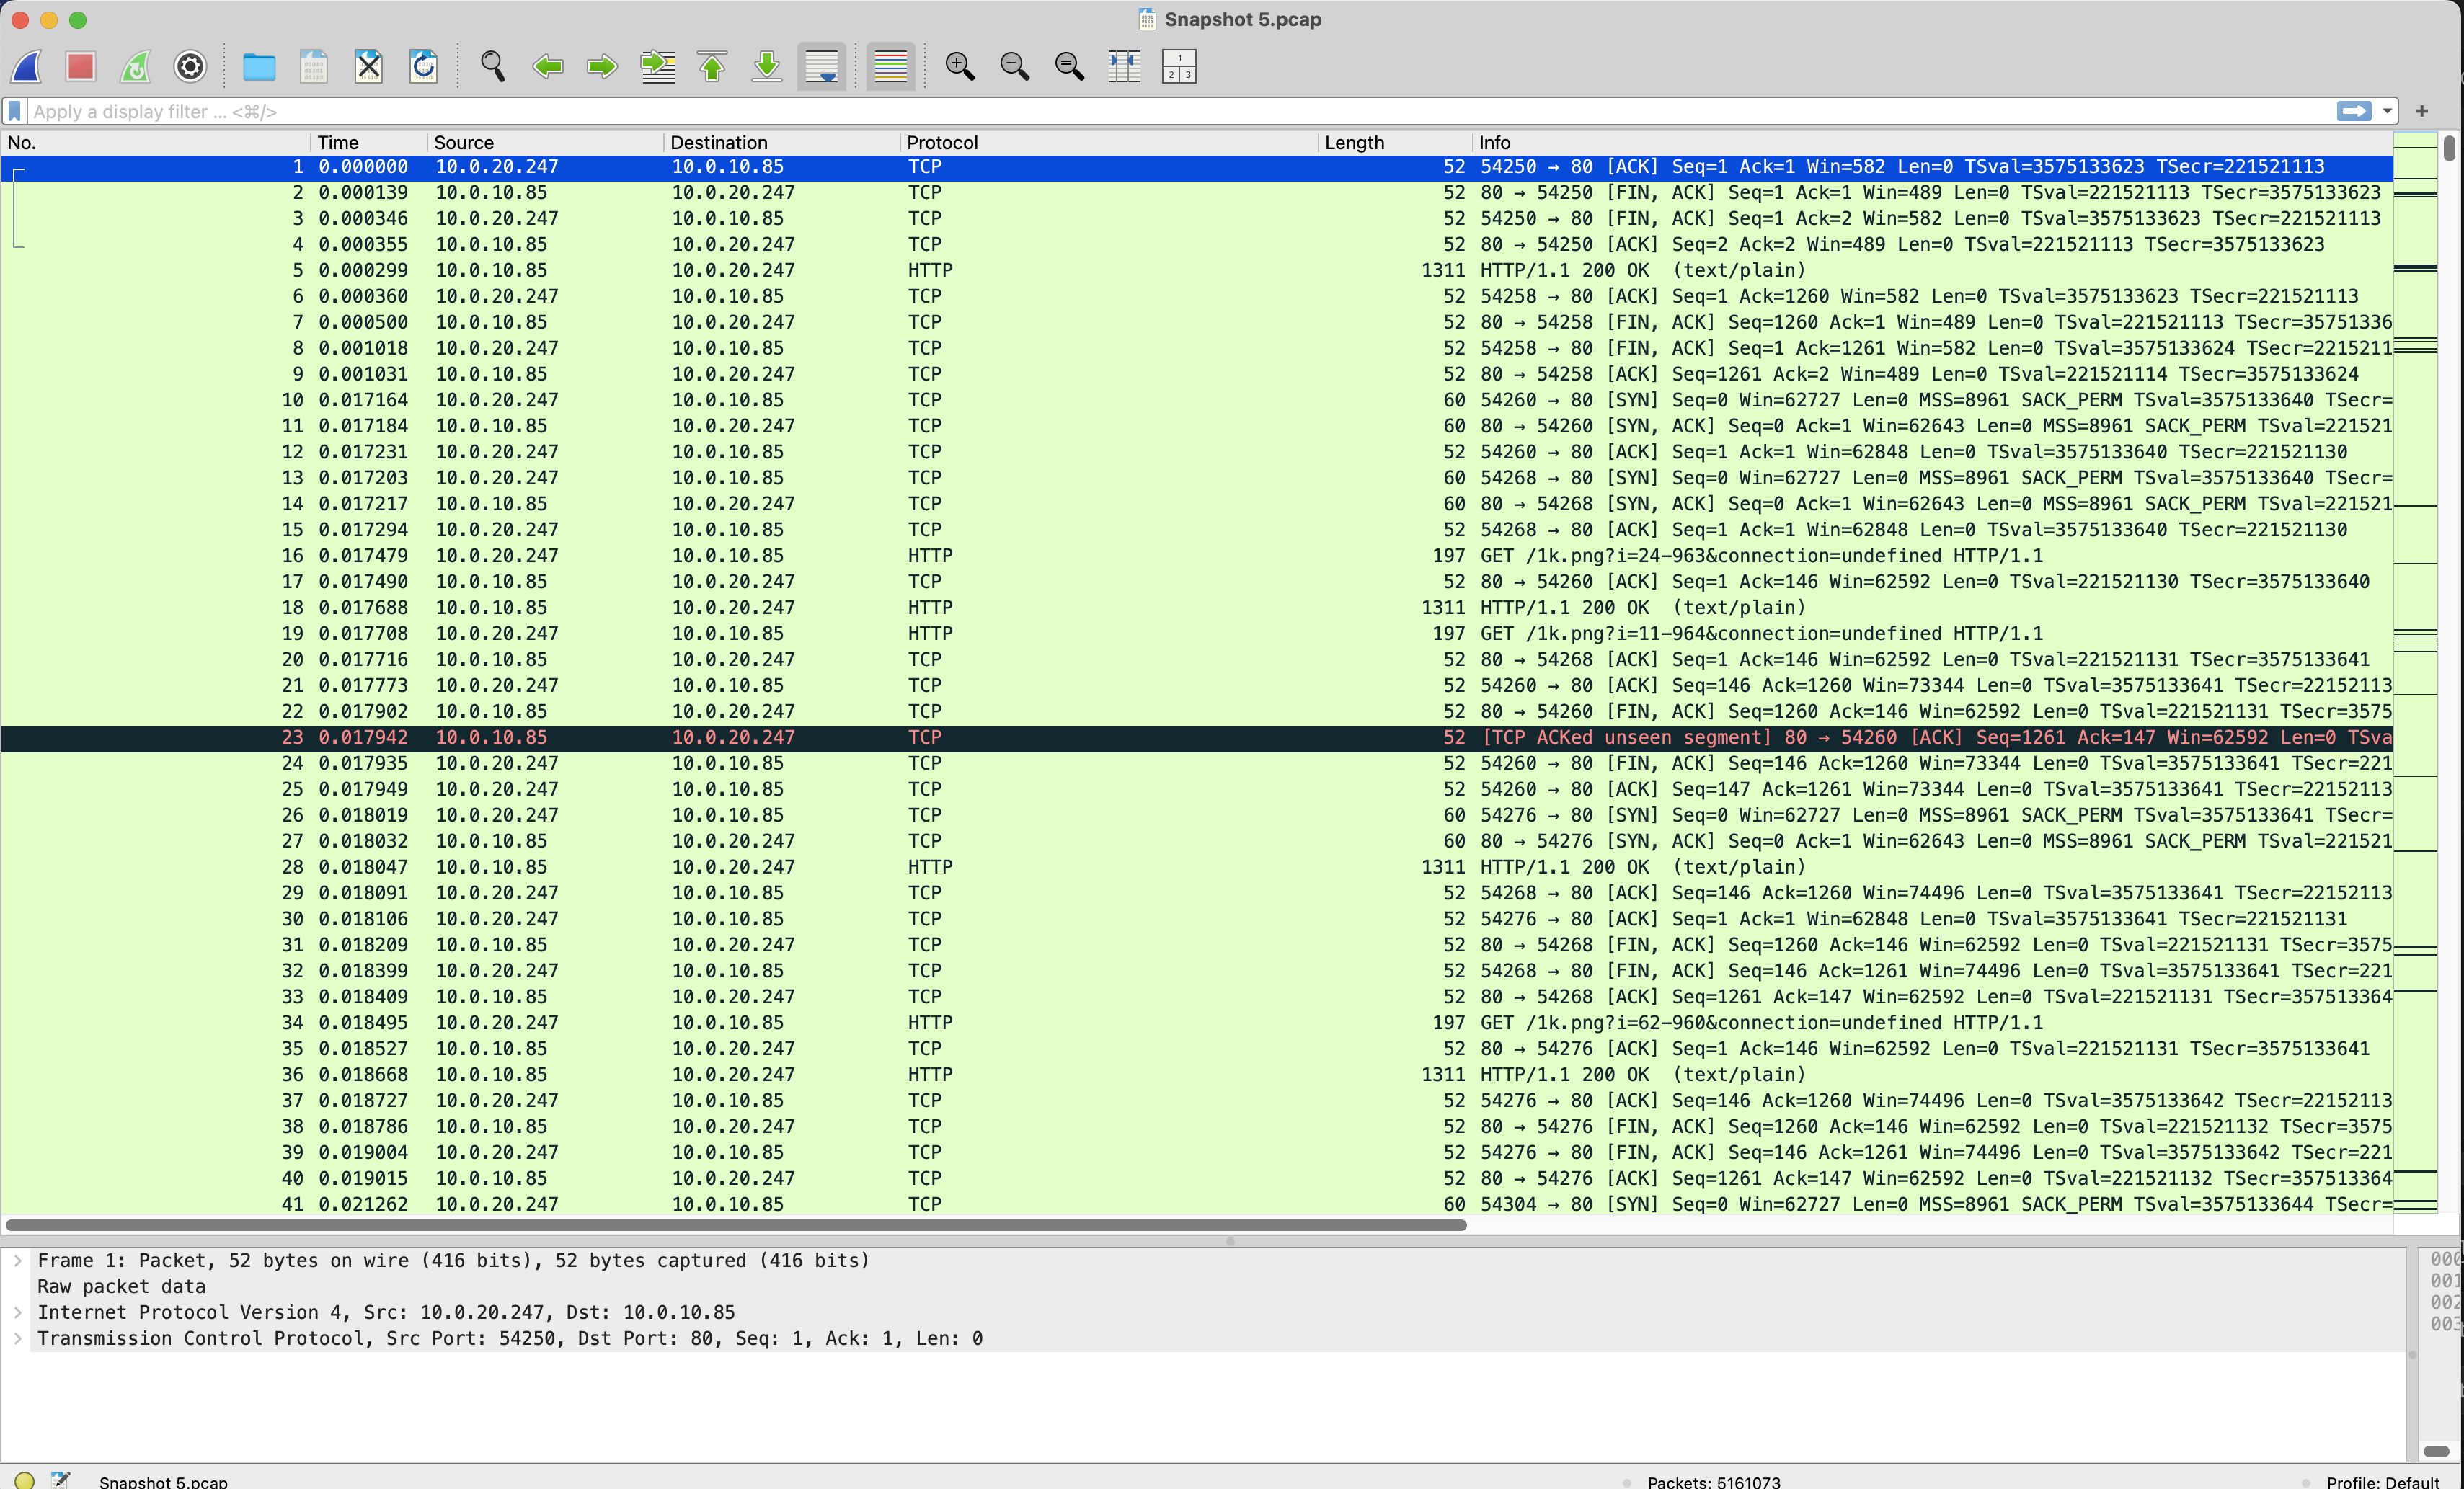
Export snapshots as PCAP files for analysis in Wireshark — no indexing required. An alternative to deploying tcpdump, copying files from nodes, and manually aggregating them.
Snapshots include all raw TCP/UDP packets, including decrypted TLS traffic, along with Kubernetes and OS context.
- Select a snapshot from the list
- Click PCAP
- Open the downloaded file in Wireshark
Delayed Indexing (Optional)
To query the snapshot’s traffic, visualize results in the dashboard, or process them with an AI agent, run Delayed Indexing.
- Select the snapshot from the list
- Click Index to start delayed indexing
- Monitor progress as the snapshot is processed
- Once complete, the snapshot appears as a traffic source in the dashboard
Indexing runs on the Hub, not on worker nodes — keeping production compute unaffected. After indexing, the snapshot’s API calls are queryable with KFL, just like real-time traffic.
Cloud Storage
When Cloud Storage is configured, a connection badge appears in the Snapshots toolbar indicating the provider and connection status:
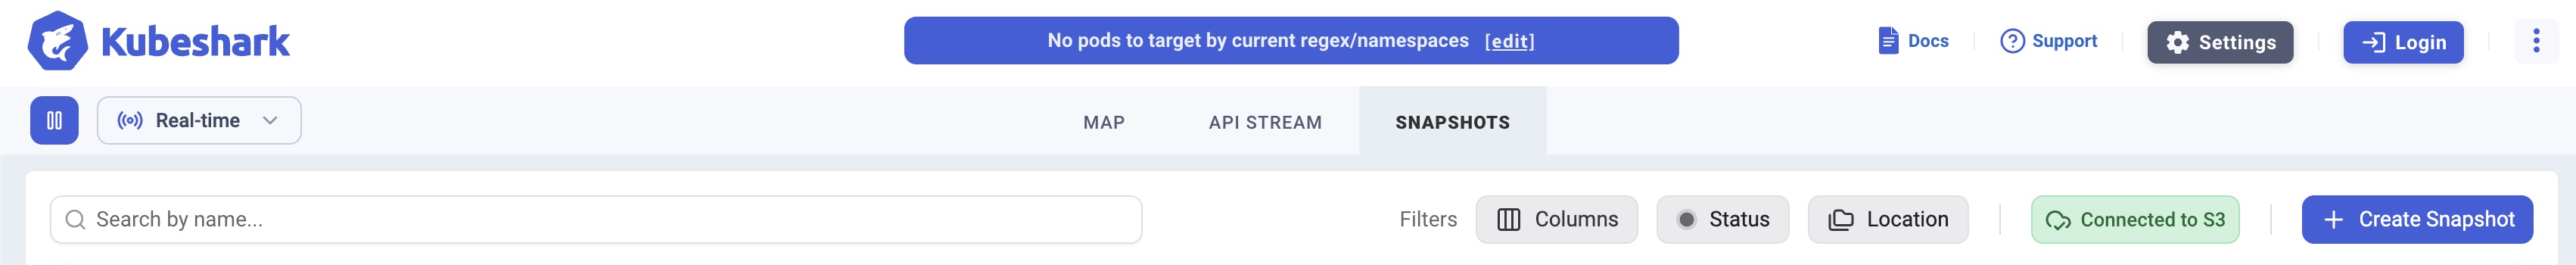
A green Connected to S3 (or Connected to Azure Blob or Connected to GCS) badge confirms the hub has validated access to the configured bucket or container. If the connection fails, the hub will not start — see Cloud Storage for Snapshots for troubleshooting.
Snapshot Location
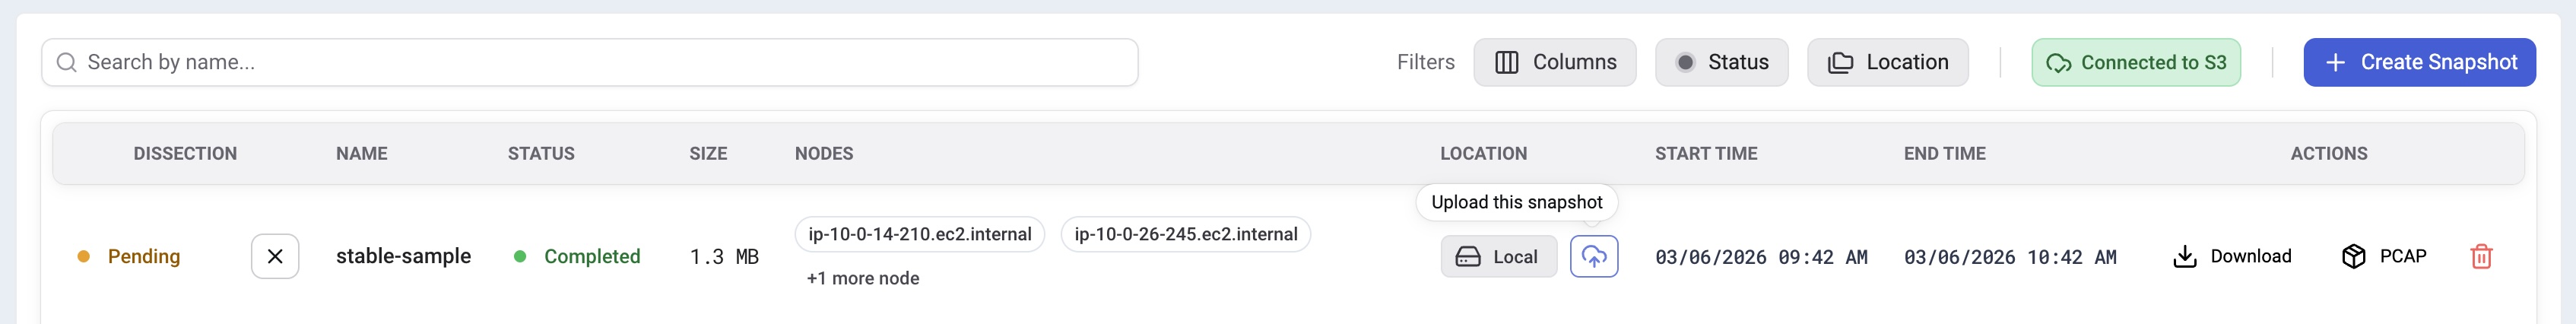
A snapshot can exist locally, in the cloud, or both. The Location column shows the current state:
| Location | Description |
|---|---|
| Local | Stored on the hub only |
| Cloud | Stored in cloud storage only |
| Local + Cloud | Stored in both locations |
All operations — Download, PCAP export, and Delayed Indexing — require the snapshot to be local. Cloud-only snapshots must be downloaded to the hub before these actions are available.
Uploading to the Cloud
New snapshots are always created locally. To upload to cloud storage, click the cloud upload button next to the Local badge:
Once uploaded, the snapshot is available from any cluster that shares the same cloud storage configuration — enabling cross-cluster sharing, backup/restore, and long-term retention.
Deleting Snapshots
Snapshots can be deleted independently from each location. When a snapshot exists in both locations, you can choose to delete it locally, from the cloud, or both.
What’s Next
- Cloud Storage for Snapshots — Configure S3, Azure Blob, or GCS storage
- KFL Reference — Query language for indexed snapshots
- Raw Capture Configuration — Storage size and capture settings