Dashboard
The Kubeshark Dashboard visualizes query results — both real-time and retrospective. Queries use Kubernetes, API, and network semantics to filter cluster-wide traffic.
In real-time mode, the dashboard displays a live stream of API calls matching your query. For retrospective analysis, it visualizes indexed traffic from snapshots. The dashboard is also where you create snapshots, upload them to cloud storage, download PCAPs, and run delayed indexing.
Traffic Source
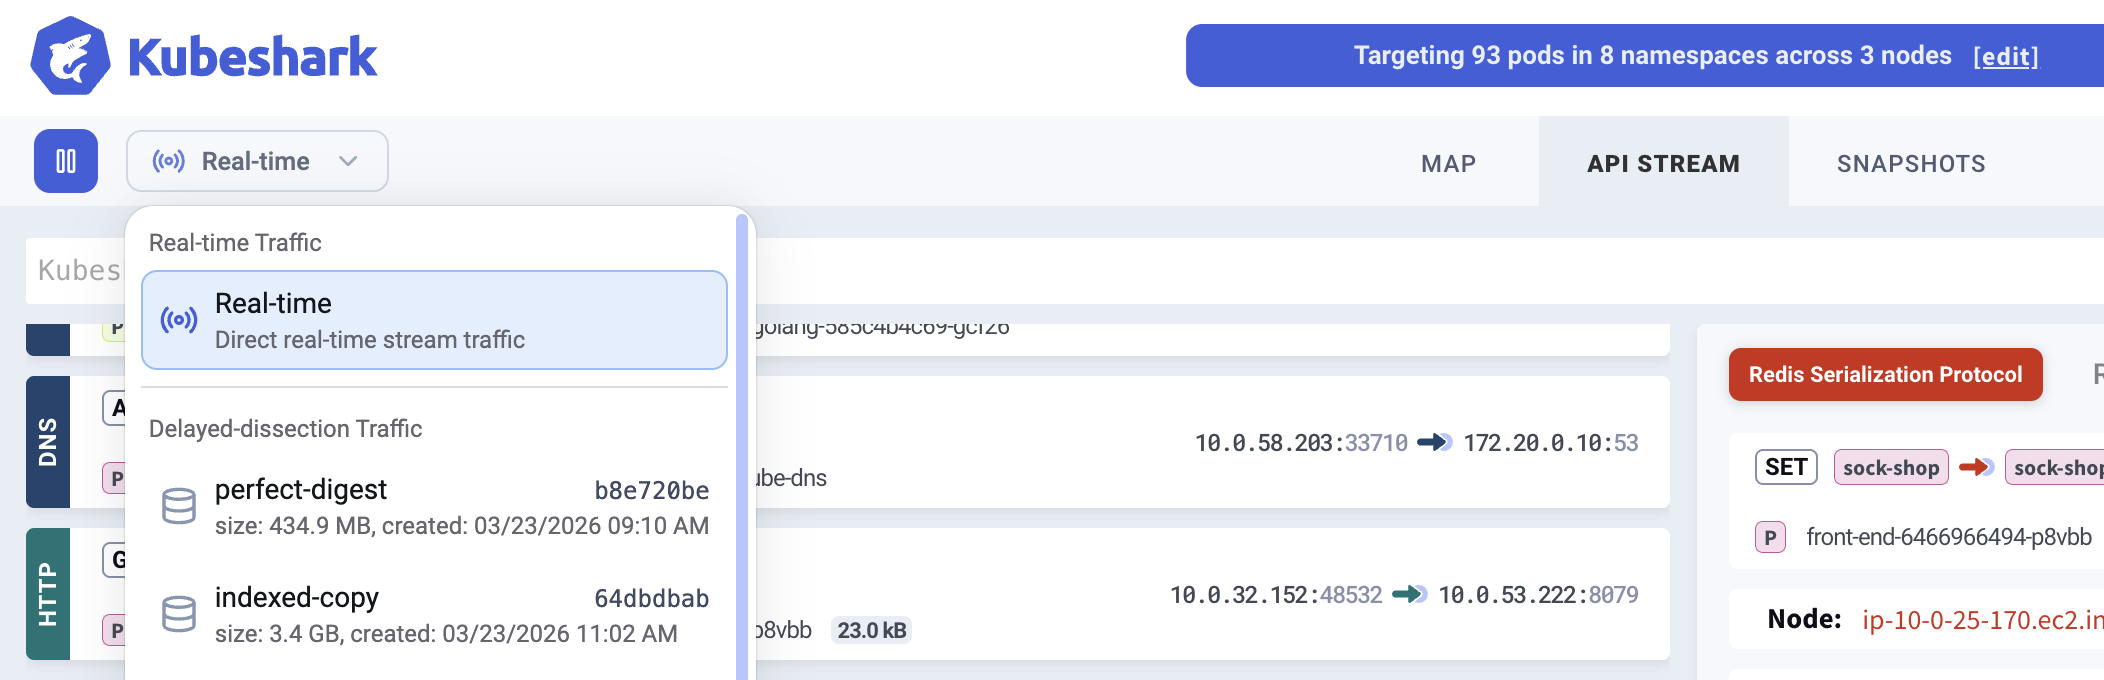
The traffic source selector controls which data the dashboard displays. By default, the source is real-time — showing live API calls as they happen.
When snapshots are indexed, they appear as additional traffic sources in the dropdown. Selecting a snapshot switches the dashboard to display the indexed traffic from that snapshot, enabling retrospective analysis with the same query and filtering capabilities as real-time.
API Stream
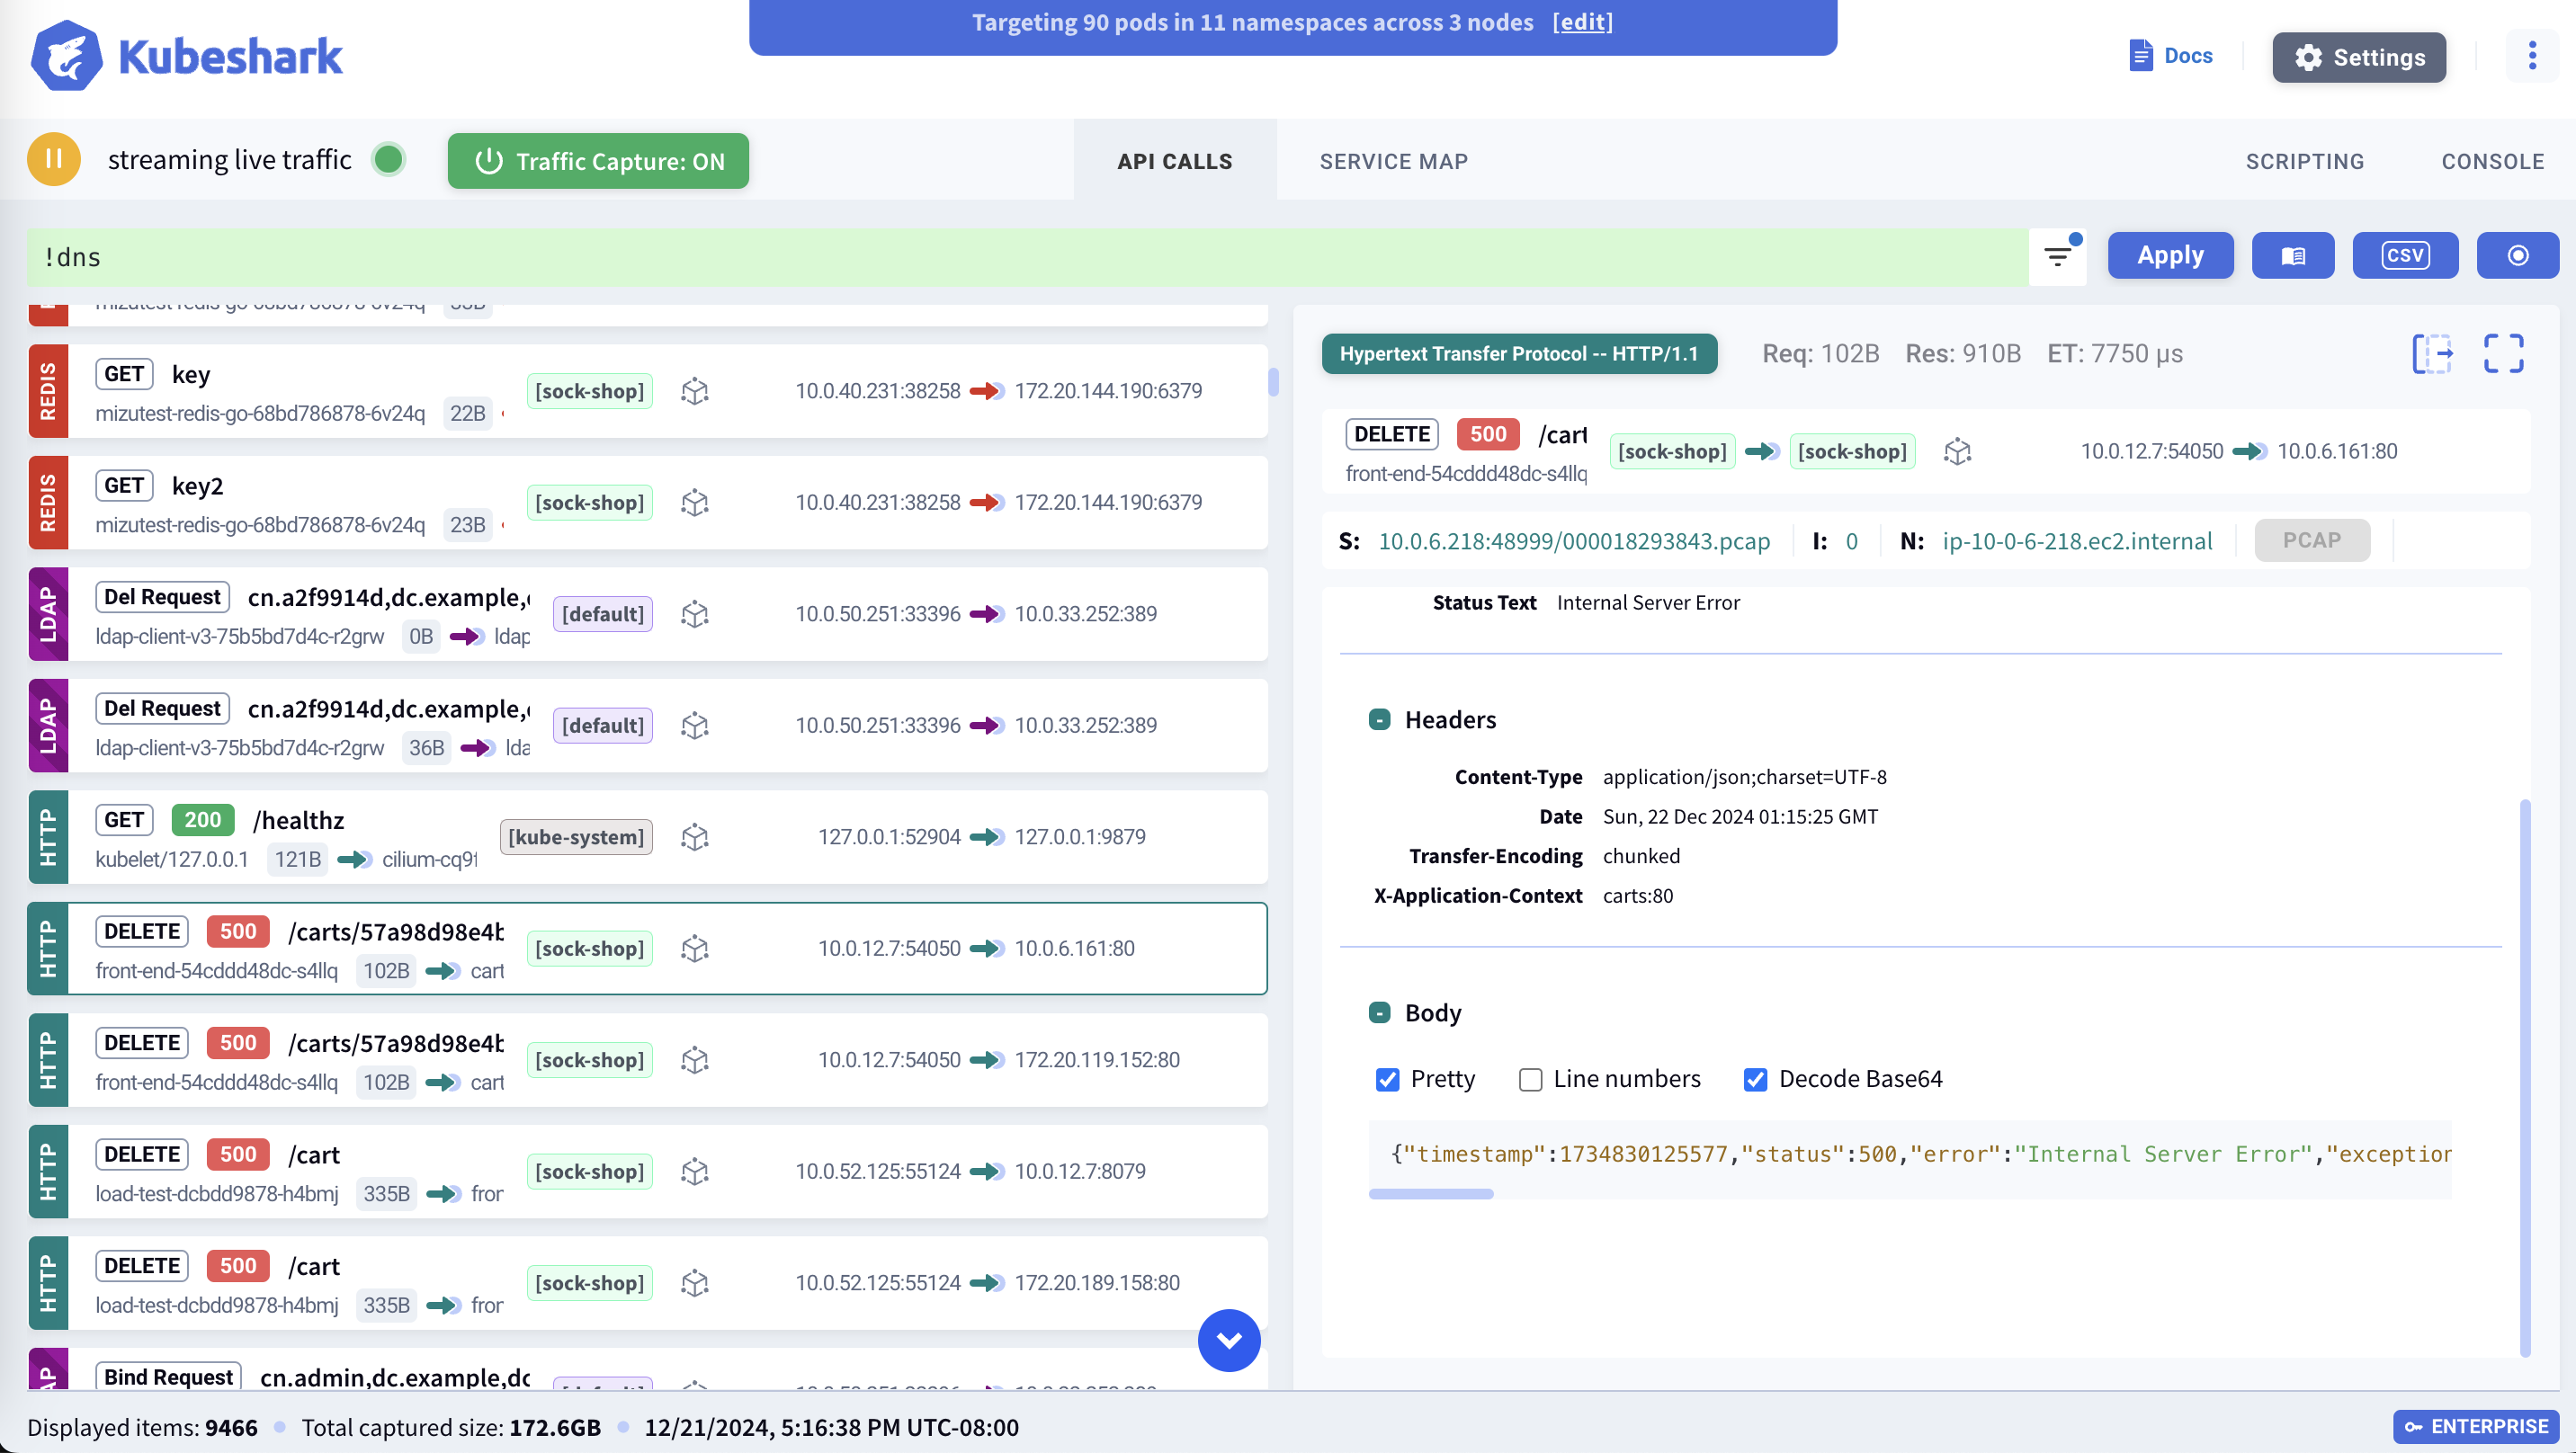
The API Stream displays cluster-wide API calls from the active traffic source — real-time or an indexed snapshot. Each entry shows the protocol, method, status code, source/destination workloads, timestamp, and latency.

Clicking any entry opens the detail panel with complete headers, full request/response payloads, TCP stream information, and timing breakdown.
Hovering over UI elements with a green plus sign indicates they are queryable — clicking appends the corresponding filter to your KFL query. Queries are embedded in the browser URL, so you can share a filtered view by copying the link.
The stream will be empty if traffic indexing is disabled.
KFL — Query Language
KFL (Kubeshark Filter Language) is the query language used across Kubeshark. Everything in Kubeshark — the dashboard stream, snapshot analysis, MCP responses — is the result of a KFL query. Queries use Kubernetes semantics (e.g. pod, namespace, node, labels), API semantics (e.g. path, headers, status code), and network semantics (e.g. IP, port, protocol).
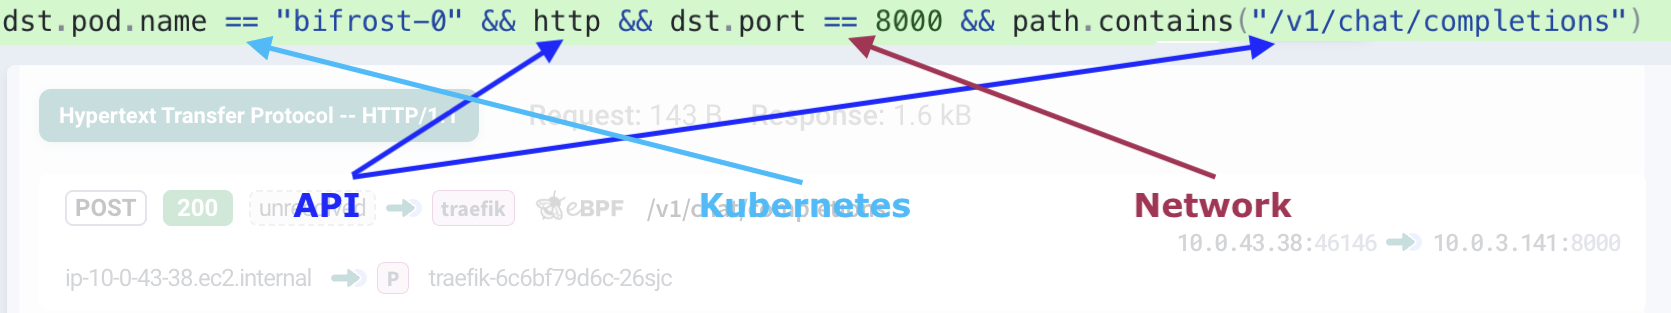
KFL is inspired by Wireshark’s display filters but designed for indexed Kubernetes traffic. Each browser tab can run its own KFL query against the active traffic source (real-time or a selected snapshot).
KFL queries only affect what is displayed. They do not impact what traffic is captured. For controlling captured traffic, see Capture Filters.
Common Queries
# By protocol
http                              # HTTP traffic
dns                               # DNS queries
redis                             # Redis commands

# By HTTP status
http && status_code >= 500        # Server errors

# By Kubernetes identity
dst.pod.namespace == "production"
src.service.name == "api-gateway"

# By headers
http && "authorization" in request.headers
See KFL Reference for complete syntax, supported variables, and advanced examples.
Workload Map
The Workload Dependency Map visualizes how workloads communicate — showing dependencies, traffic volume, and protocol usage across the cluster. The map updates live and responds to the active KFL query, filtering connections to match.
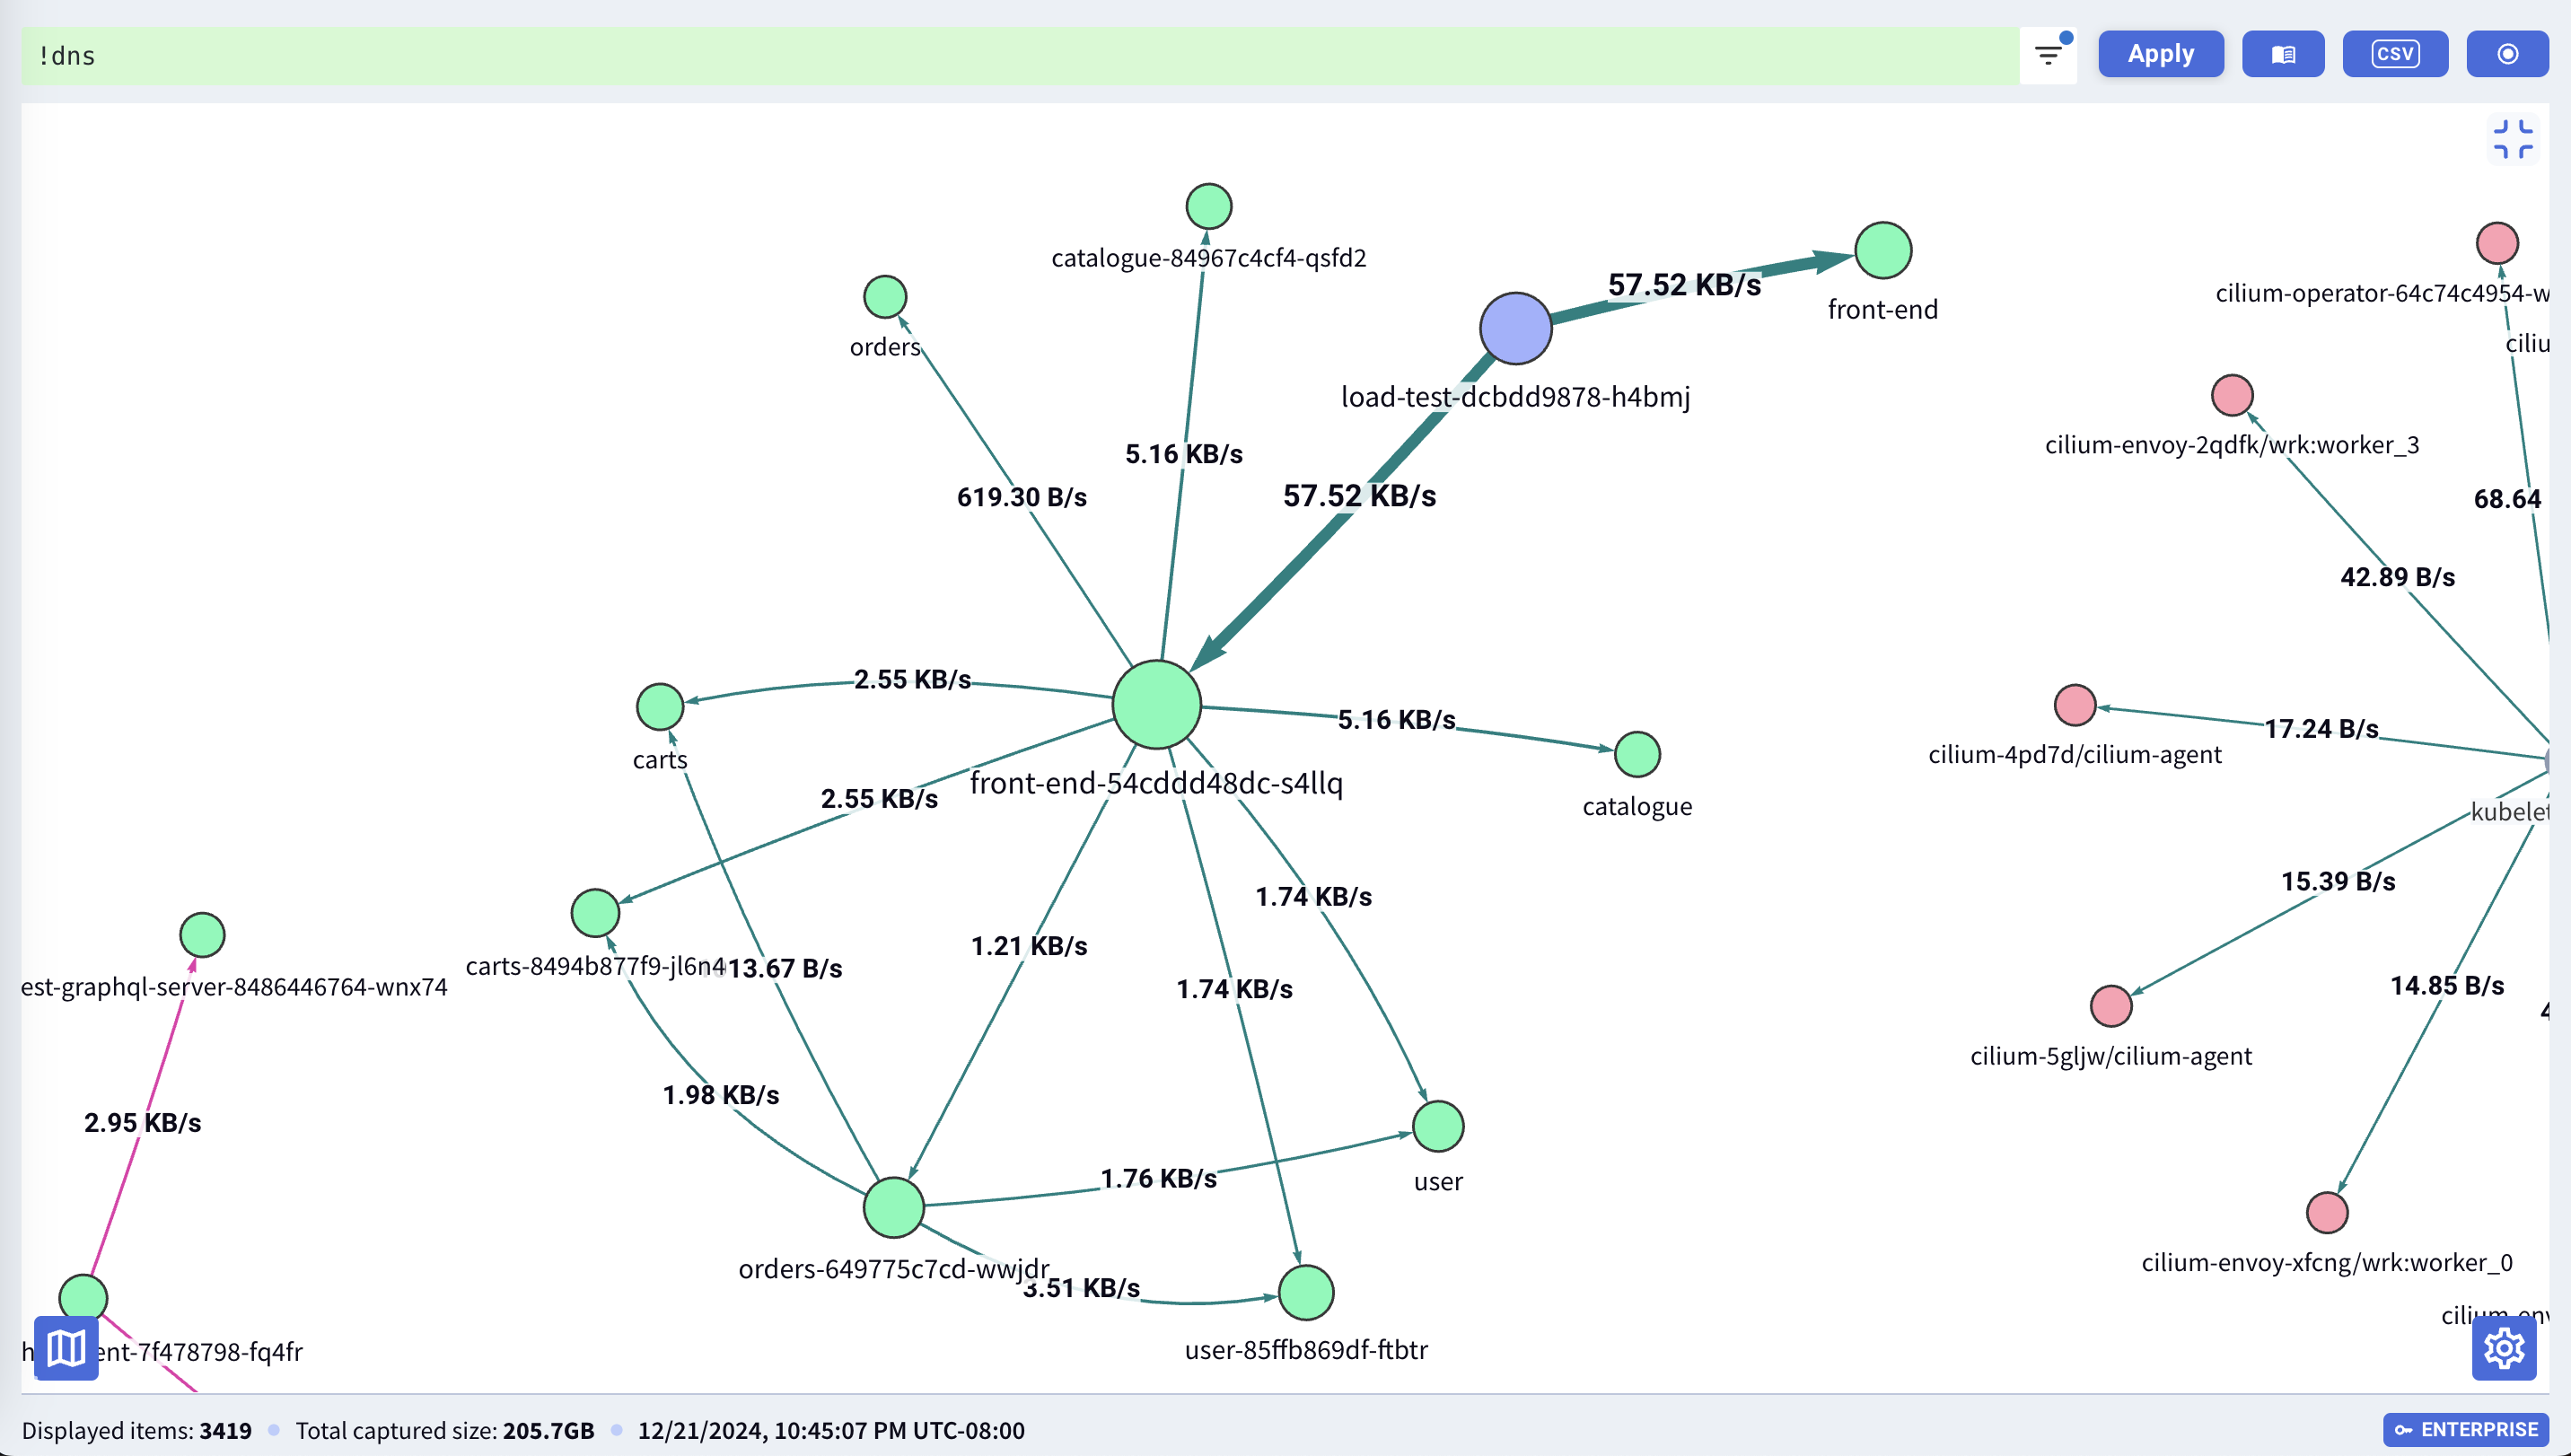
See Workload Dependency Map for details.
Enabling / Disabling Real-time Indexing
Real-time traffic indexing can be toggled on or off from the dashboard. Disabling it when not actively needed conserves production resources — CPU and memory on worker nodes. Raw Capture and Snapshots continue to work independently, so traffic is still being recorded even when real-time indexing is off.
| State | Button |
|---|---|
| Paused | 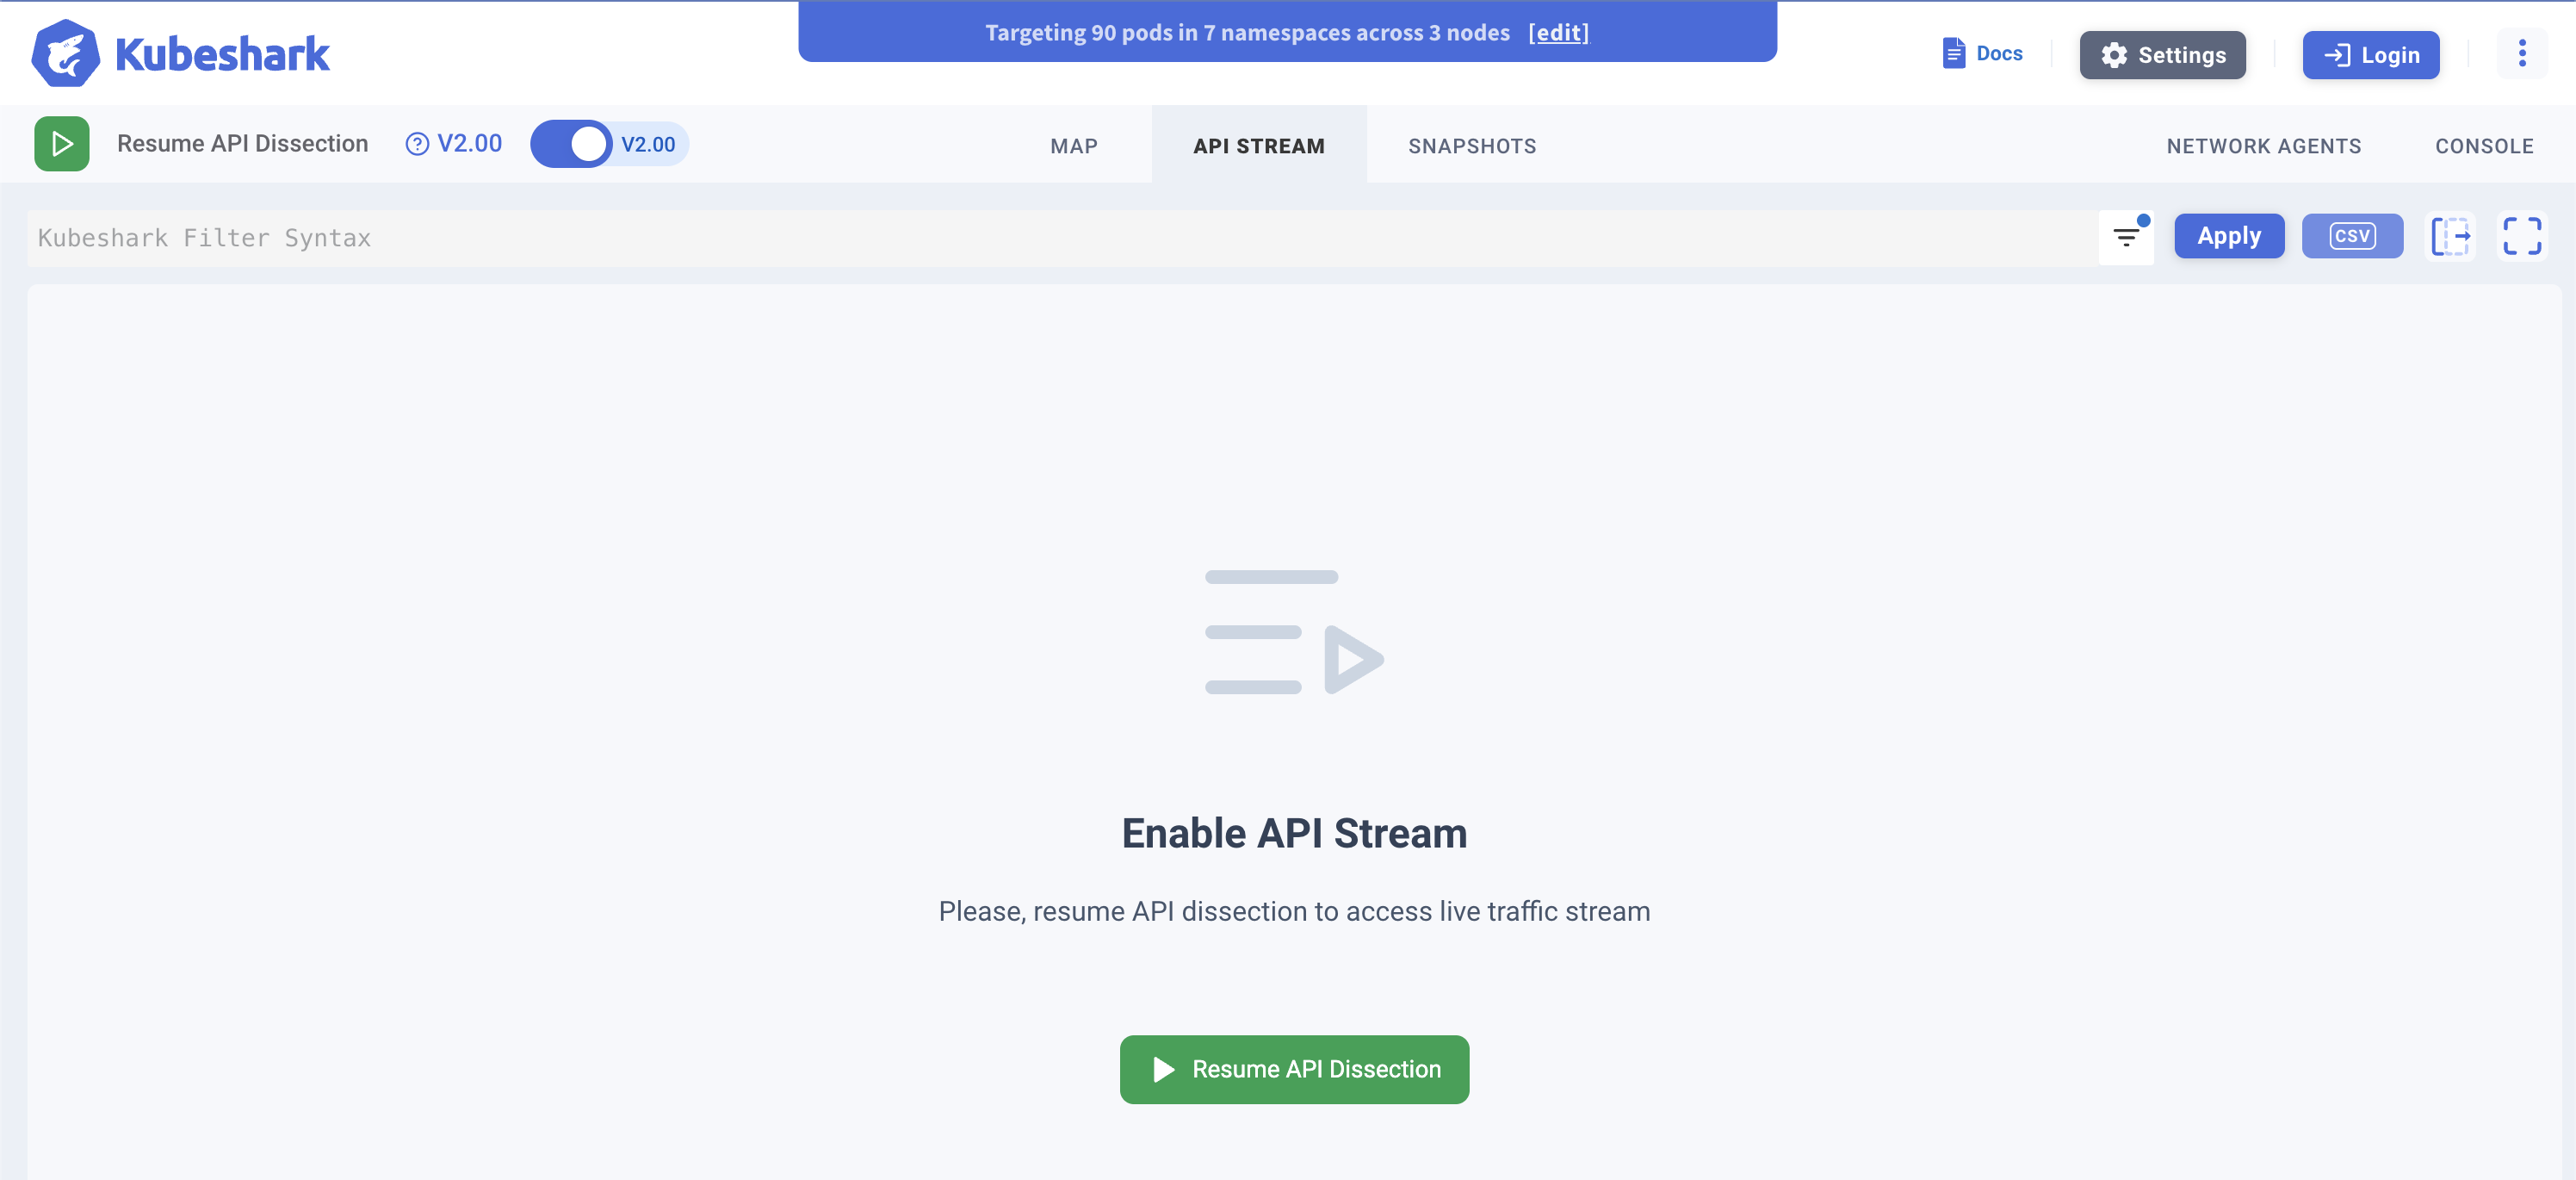 |
| Active | 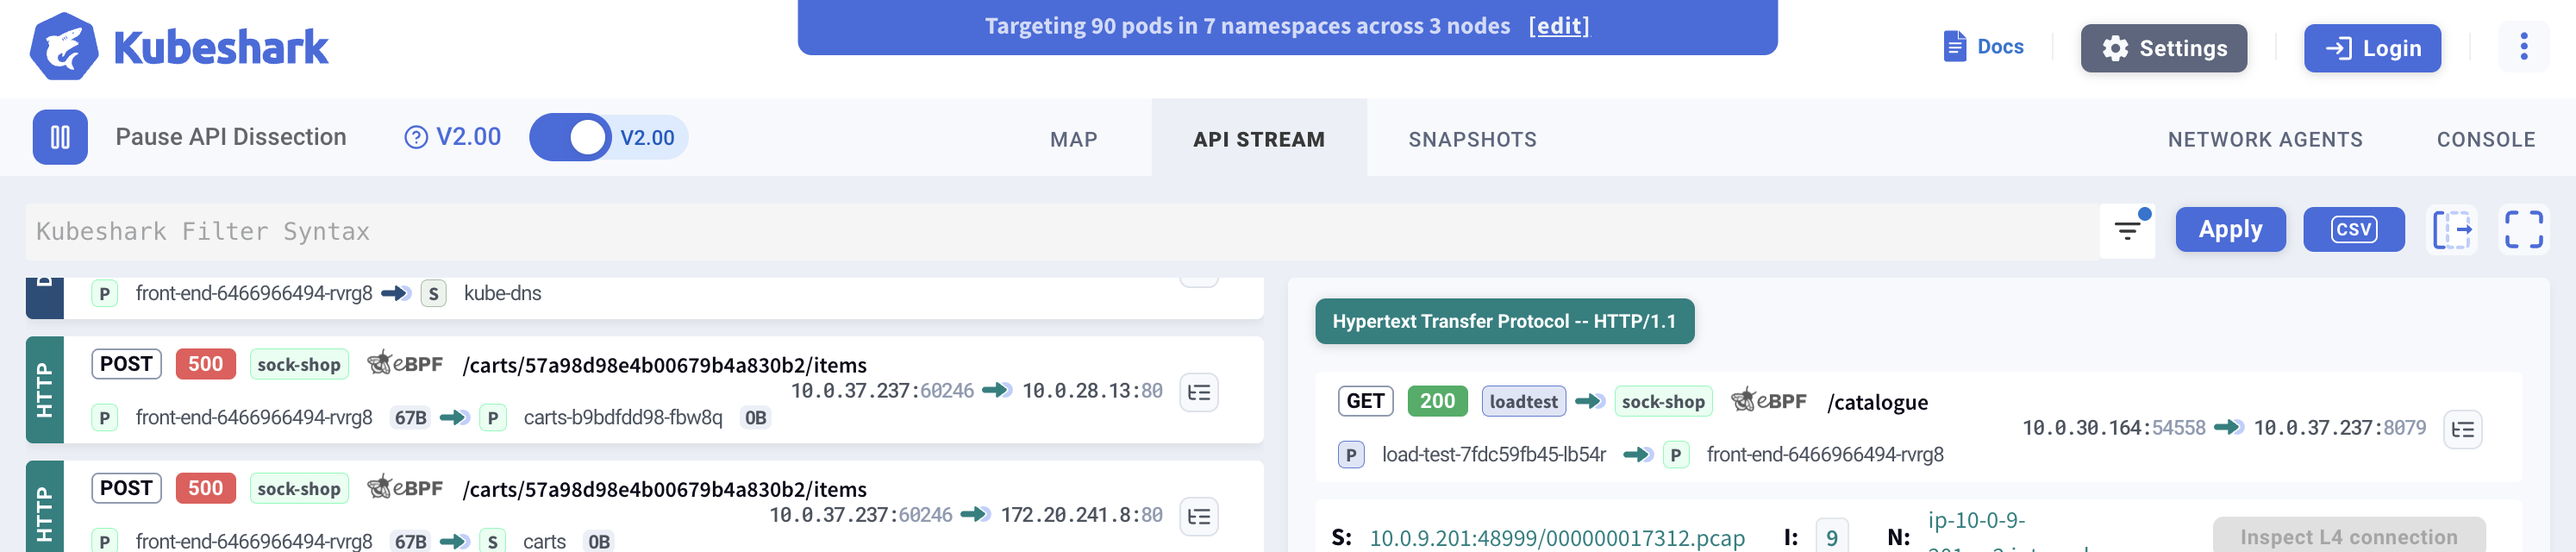 |
By default, indexing automatically pauses after 5 minutes of inactivity. Set tap.capture.dissection.stopAfter: 0 in Helm values to keep it running continuously.
More Dashboard Features
| Feature | Description |
|---|---|
| Snapshots | Create, browse, and manage traffic snapshots. Run delayed indexing, download PCAPs, upload to cloud storage. |
| Capture Filters | Control which pods are captured. The targeted pod list updates in real-time and is cluster-wide — affects all users and sessions. |
| Settings | Dashboard configuration, capture filter controls, and display options. |
| Ingress | Configure external access to the dashboard with TLS and authentication. |
What’s Next
- KFL Reference — Query language syntax
- Workload Dependency Map — Dependency visualization
- Traffic Snapshots — Capture historical traffic