Network Observability for SREs & AI Agents
Kubeshark indexes cluster-wide network traffic at the kernel level using eBPF — delivering instant answers to any query using network, API, and Kubernetes semantics.
What you can do:
- Download Retrospective PCAPs — cluster-wide packet captures filtered by nodes, time, workloads, and IPs. Store PCAPs for long-term retention and later investigation.
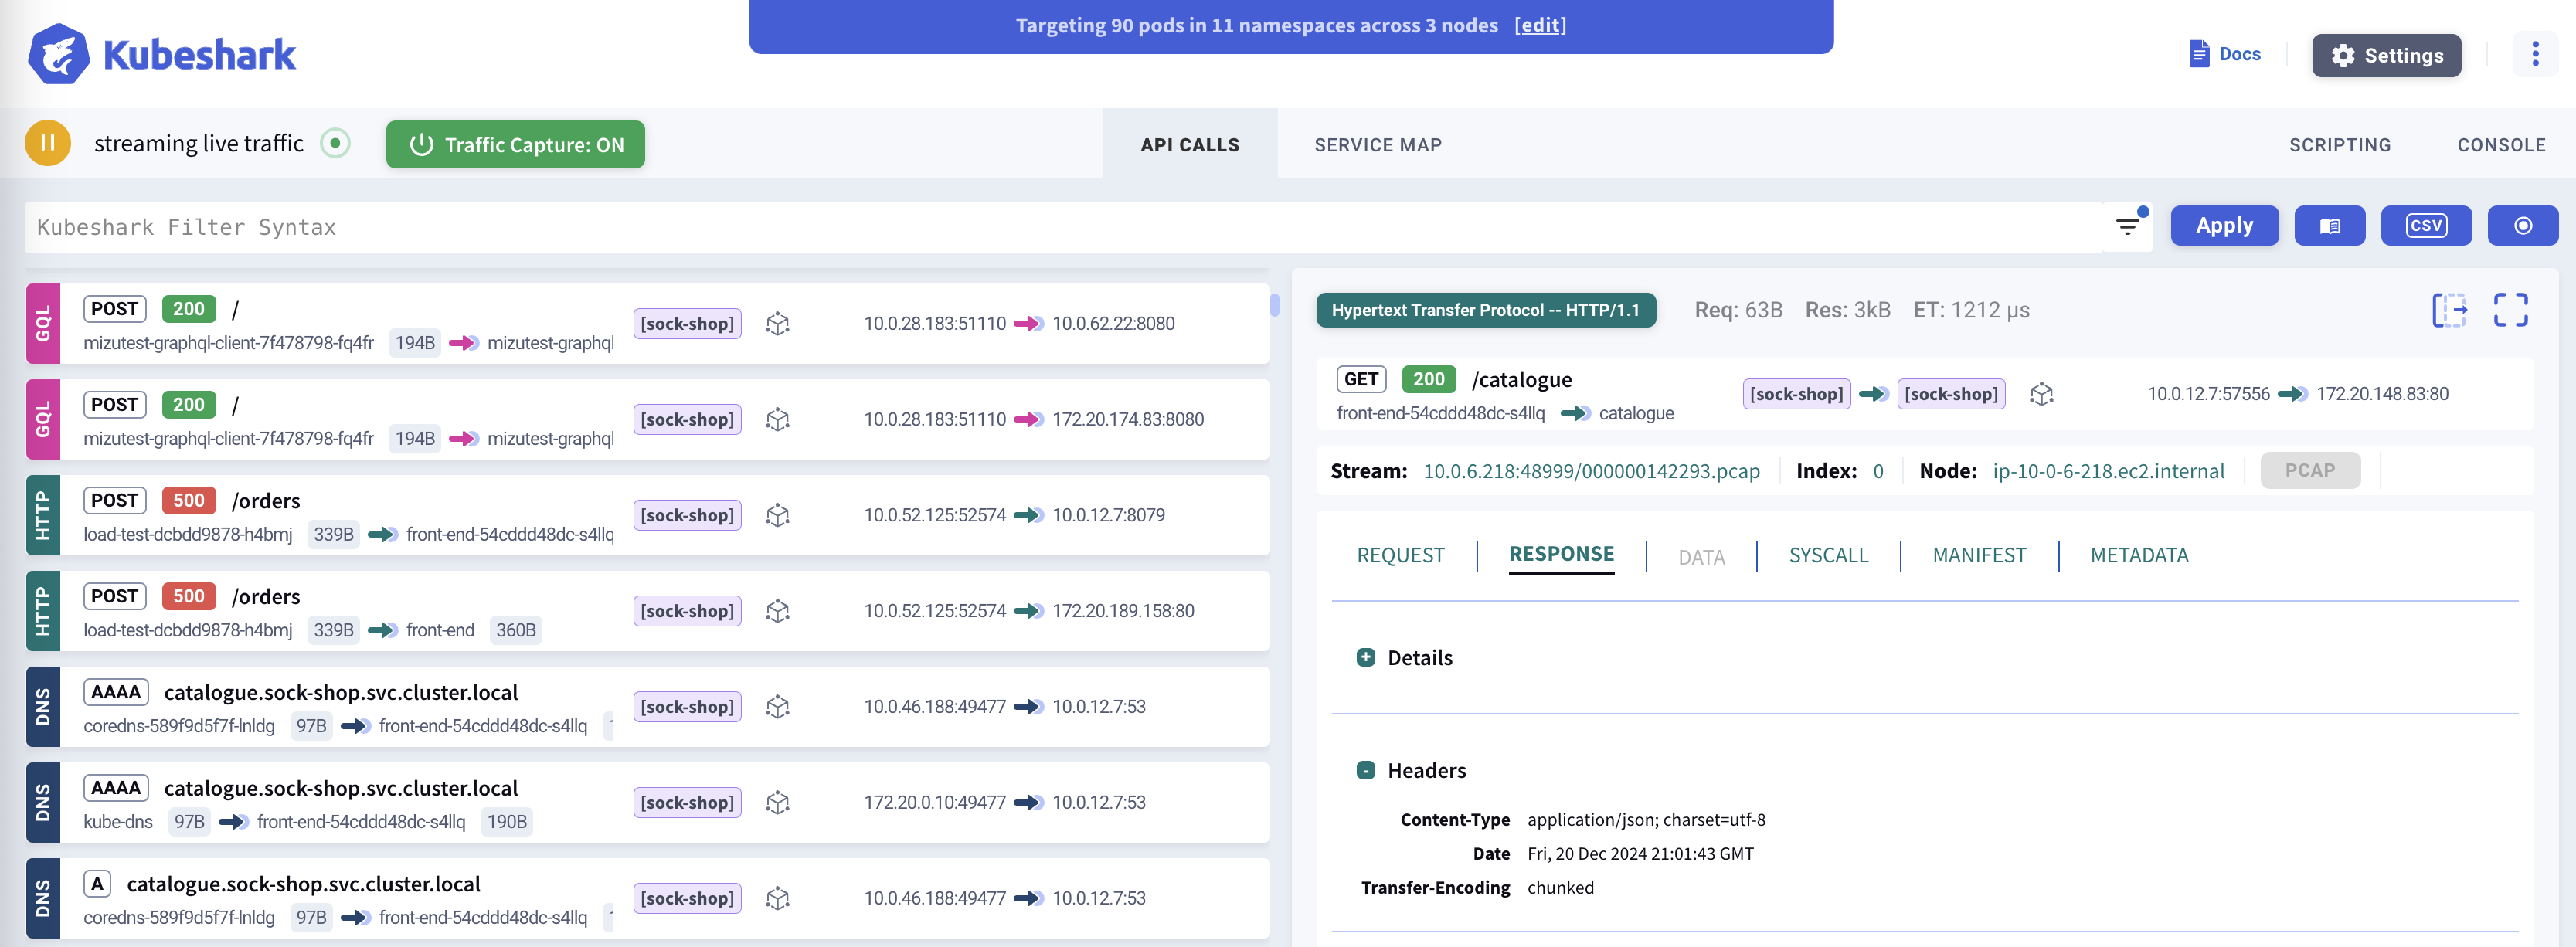
- Visualize Network Data — explore traffic matching queries with API, Kubernetes, or network semantics through a real-time dashboard.
- Decrypt TLS Traffic — inspect encrypted traffic — including mTLS in service meshes — in clear text, with no keys, no certificates, and no sidecars.
- Integrate with AI — connect your favorite AI assistant (e.g. Claude, Copilot) to include network data in AI-driven workflows like incident response and root cause analysis.
Network Data for AI Agents
Kubeshark exposes cluster-wide network data via MCP — enabling AI agents to query traffic, investigate API calls, and perform root cause analysis through natural language.
“Why did checkout fail at 2:15 PM?” “Which services have error rates above 1%?” “Show TCP retransmission rates across all node-to-node paths” “Trace request abc123 through all services”
Works with Claude Code, Cursor, and any MCP-compatible AI.
The above is a recording of a live session
TLS Decryption — See Encrypted Traffic in Clear Text
Encrypted traffic is a blind spot for most observability tools. Kubeshark removes that blind spot: it hooks the cryptographic library inside each workload with eBPF and captures plaintext directly from process memory — no private keys, no certificates, no sidecars, no application changes.
- Works across OpenSSL, BoringSSL, and Go
crypto/tls— dynamically or statically linked, stripped or unstripped. - Covers the dominant share of cloud-native workloads: nginx, HAProxy, Envoy, Istio, Traefik, Kong, APISIX, PostgreSQL, MySQL, Redis, MongoDB, RabbitMQ, and more.
- Service-mesh mTLS (Istio, Cilium Service Mesh, Consul Connect, Envoy-based meshes) is decrypted automatically — no extra setup.
See supported images and how it works →
Protocol Support
Kubeshark supports 23+ protocols across multiple layers:
| Category | Protocols |
|---|---|
| HTTP/REST | HTTP/1.0, HTTP/1.1, HTTP/2, WebSocket, GraphQL |
| Messaging | Apache Kafka, AMQP (RabbitMQ), Redis |
| Database | MongoDB, MySQL, PostgreSQL |
| RPC | gRPC over HTTP/2 |
| Authentication | LDAP, RADIUS, DIAMETER |
| Network | DNS, ICMP, TCP, UDP, SCTP |
| Security | TLS (with automatic decryption) |
View full protocol documentation →
Top Use-Cases
Incident Response & Root Cause Analysis
Retrieve traffic snapshots from any point in time, index them into queryable API calls, and pinpoint the root cause — manually or through AI agents.
Network Observability
Real-time and retrospective deep packet inspection across every node. Filter and explore traffic with Kubernetes, API, and network semantics.
Traffic Retention & PCAP Export
Continuously capture raw traffic cluster-wide. Export PCAPs scoped by time, node, workload, and IP for Wireshark or long-term storage.
Security & Compliance
Detect sensitive data, anomalies, and policy violations in network traffic. Immutable retention provides forensic evidence for audits and compliance.
Next Steps
- Installation Guide - Detailed setup instructions
- AI Integration (MCP) - Connect AI agents to network data
- Dashboard Overview - Learn the Kubeshark interface
- Best Practices - Production deployment tips