Real-time Traffic Inspection
Not every investigation starts with an incident. Often, engineers need to see what’s happening on the network right now — to debug a misbehaving service, verify a deployment, understand how services communicate, or simply answer the question: “what is this service actually sending and receiving?”
Kubeshark provides live, full-payload inspection of all traffic flowing through your Kubernetes cluster — HTTP, gRPC, Redis, Kafka, DNS, and more — enriched with Kubernetes identity and without any application instrumentation.
Why Real-time Inspection Matters
Traditional debugging follows a slow, iterative loop: read logs, form a hypothesis, add more logging, redeploy, wait for the issue to recur, and repeat. This cycle is slow even for simple bugs, and painful for distributed systems where the problem may span multiple services.
Real-time traffic inspection short-circuits this loop. Instead of guessing what a service is sending or receiving, you look directly at the wire:
- See the exact HTTP request a client is sending — headers, body, query parameters
- See the exact response a server returns — status code, payload, timing
- Watch service-to-service communication patterns in real time
- Spot errors, unexpected payloads, and protocol mismatches immediately
No code changes. No redeployments. No waiting.
What You Can Inspect
L7 API Traffic
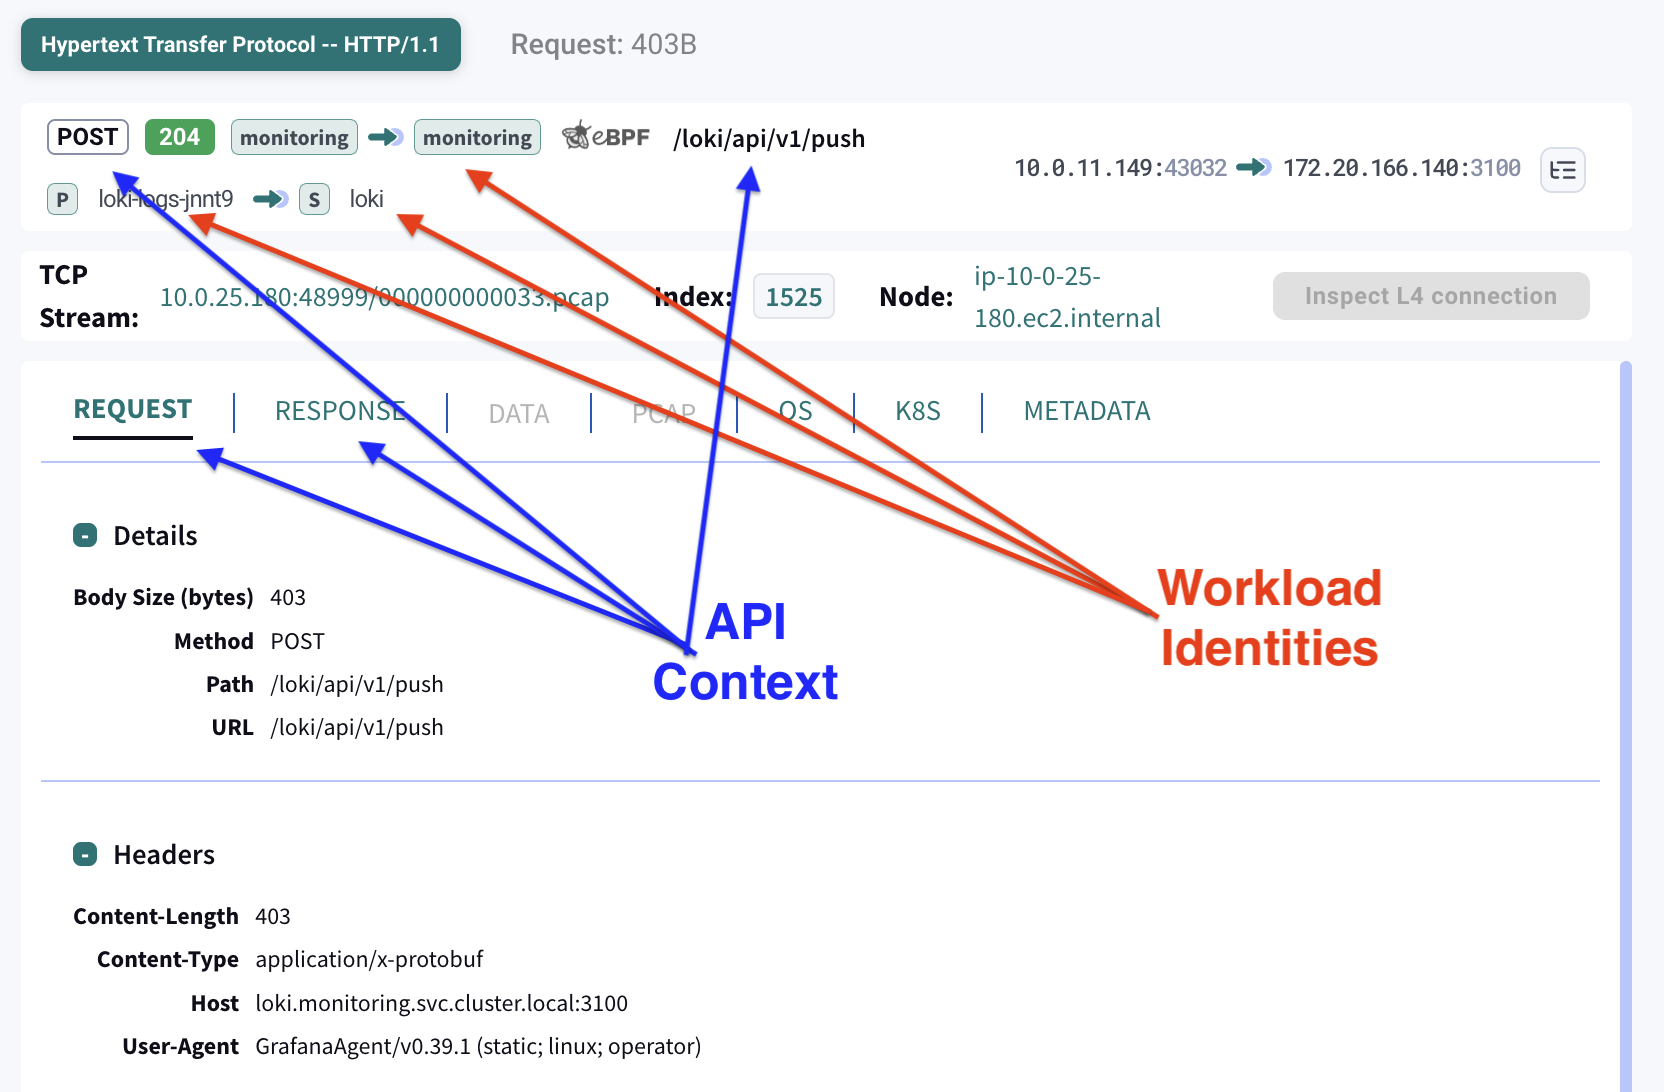
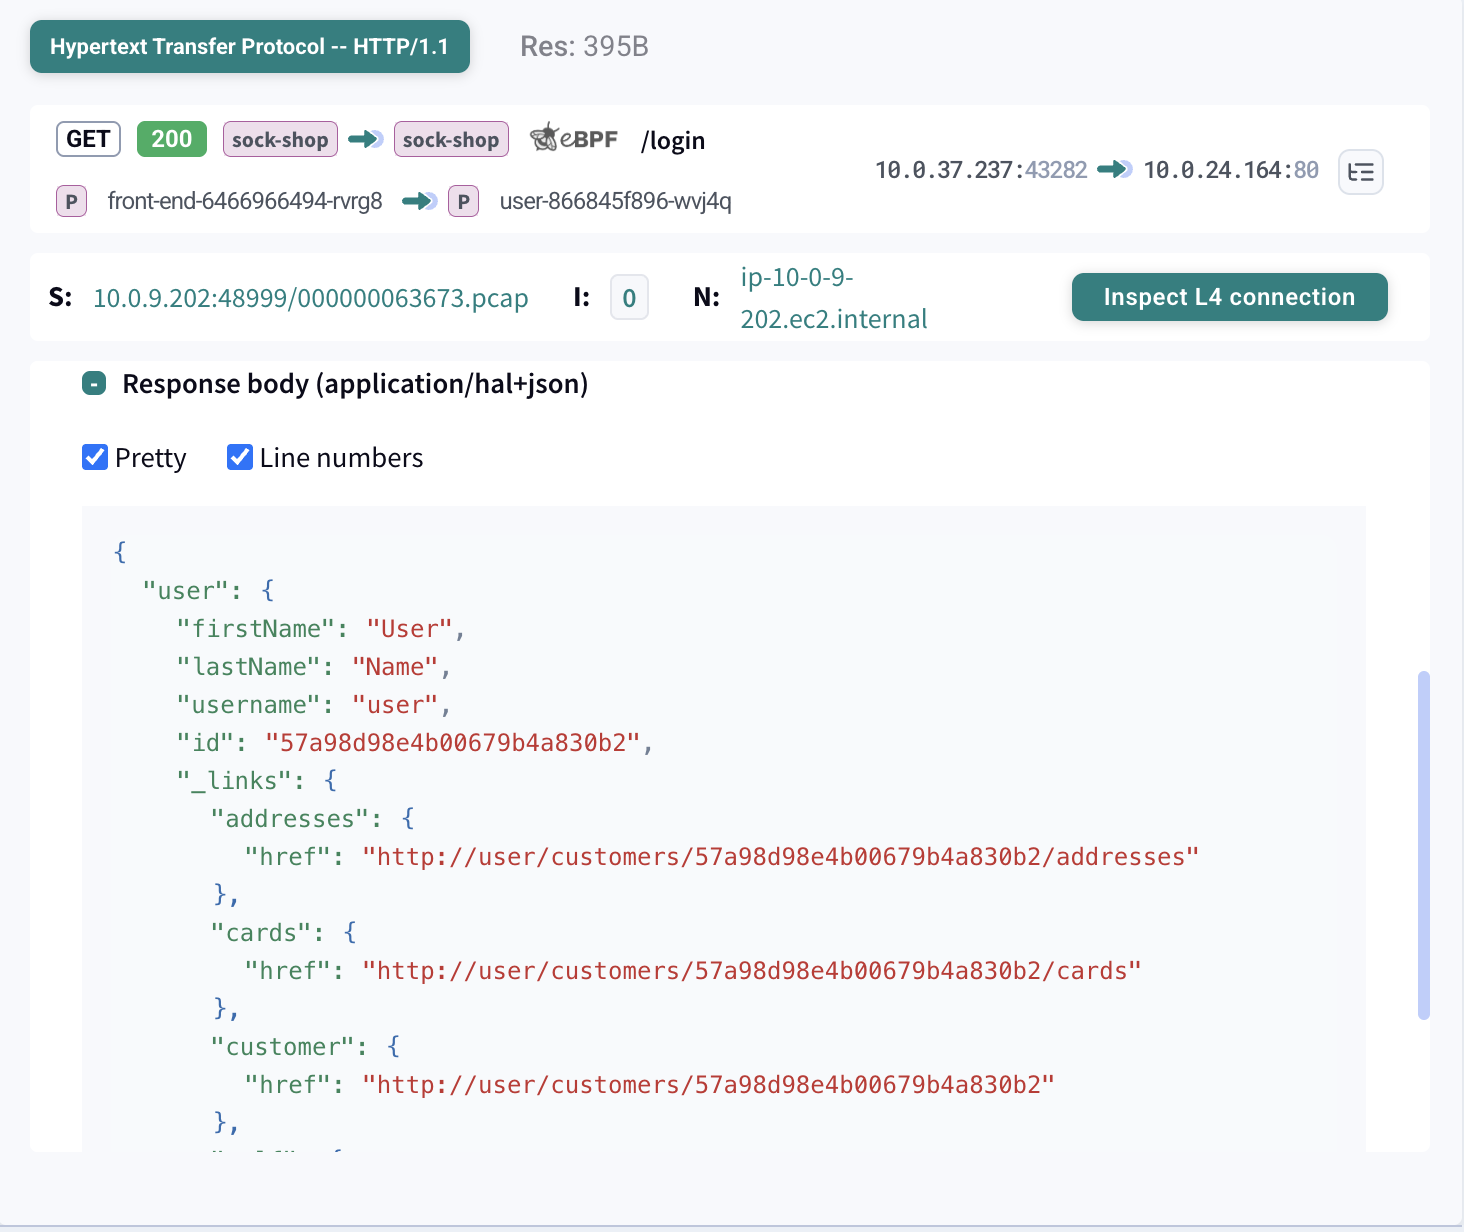
Kubeshark performs real-time L7 dissection, reconstructing full application-layer conversations from raw packets:
| Protocol | What You See |
|---|---|
| HTTP/HTTPS | Method, URL, headers, request/response body, status code, timing |
| gRPC | Service, method, protobuf payloads (decoded), status, metadata |
| Redis | Commands, keys, values, response types |
| Kafka | Topics, partitions, message keys and values, consumer groups |
| DNS | Queries, responses, resolution latency, failure codes |
| AMQP | Exchanges, routing keys, message payloads |
All traffic is correlated with Kubernetes identity — you see pod names, services, namespaces, and labels, not just IP addresses and ports.
For encrypted traffic, Kubeshark supports TLS decryption, allowing full inspection of HTTPS and other TLS-encrypted protocols.
L4 Network Flows
Below the application layer, Kubeshark captures L4 flow data providing real-time visibility into every TCP and UDP connection in the cluster:
- TCP connection lifecycle — handshakes, data transfer, teardown
- Handshake RTT percentiles — P50, P90, and P99 round-trip times of the TCP 3-way handshake, measured via eBPF with zero packet inspection overhead
- Traffic volume — bytes, packets, and throughput per flow
- Connection resets — services crashing, rejecting connections, or hitting resource limits
L4 Expert Insights
When real-time dissection is enabled, Kubeshark goes deeper — providing Wireshark-grade TCP metrics for every TCP connection in real time:
| Metric | What It Reveals |
|---|---|
| Initial RTT | Baseline network latency measured from the TCP handshake — the cleanest RTT measurement, free of application processing delay |
| Retransmission rate | Packet loss on the wire. Below 1% is healthy; 1-5% is degraded; above 5% indicates severe congestion or a faulty link |
| Fast retransmissions | Subset of retransmissions triggered by duplicate ACKs — the network is losing packets but recovering quickly |
| Zero-window events | The receiving application is overwhelmed and can’t read data fast enough — an application bottleneck, not a network problem |
| Window-full events | The sender filled the receiver’s buffer and must wait — may need TCP tuning on high-throughput connections |
| RTT jitter | Variability in round-trip time. High jitter with low base RTT points to bufferbloat or burst traffic |
| Out-of-order packets | Packets arriving out of sequence — often caused by ECMP routing doing per-packet (instead of per-flow) load balancing |
| Connection completeness | A bitmask tracking the full connection lifecycle — SYN, SYN-ACK, ACK, DATA, FIN, RST — instantly revealing incomplete handshakes, resets, and abnormal terminations |
| Goodput | Useful application data delivered, excluding retransmission overhead — shows how much bandwidth is actually productive |
These metrics turn Kubeshark into a real-time network health monitor. Instead of waiting for application-level symptoms (timeouts, errors) to surface, you can see network-level problems — packet loss, congestion, receiver backpressure — as they develop.
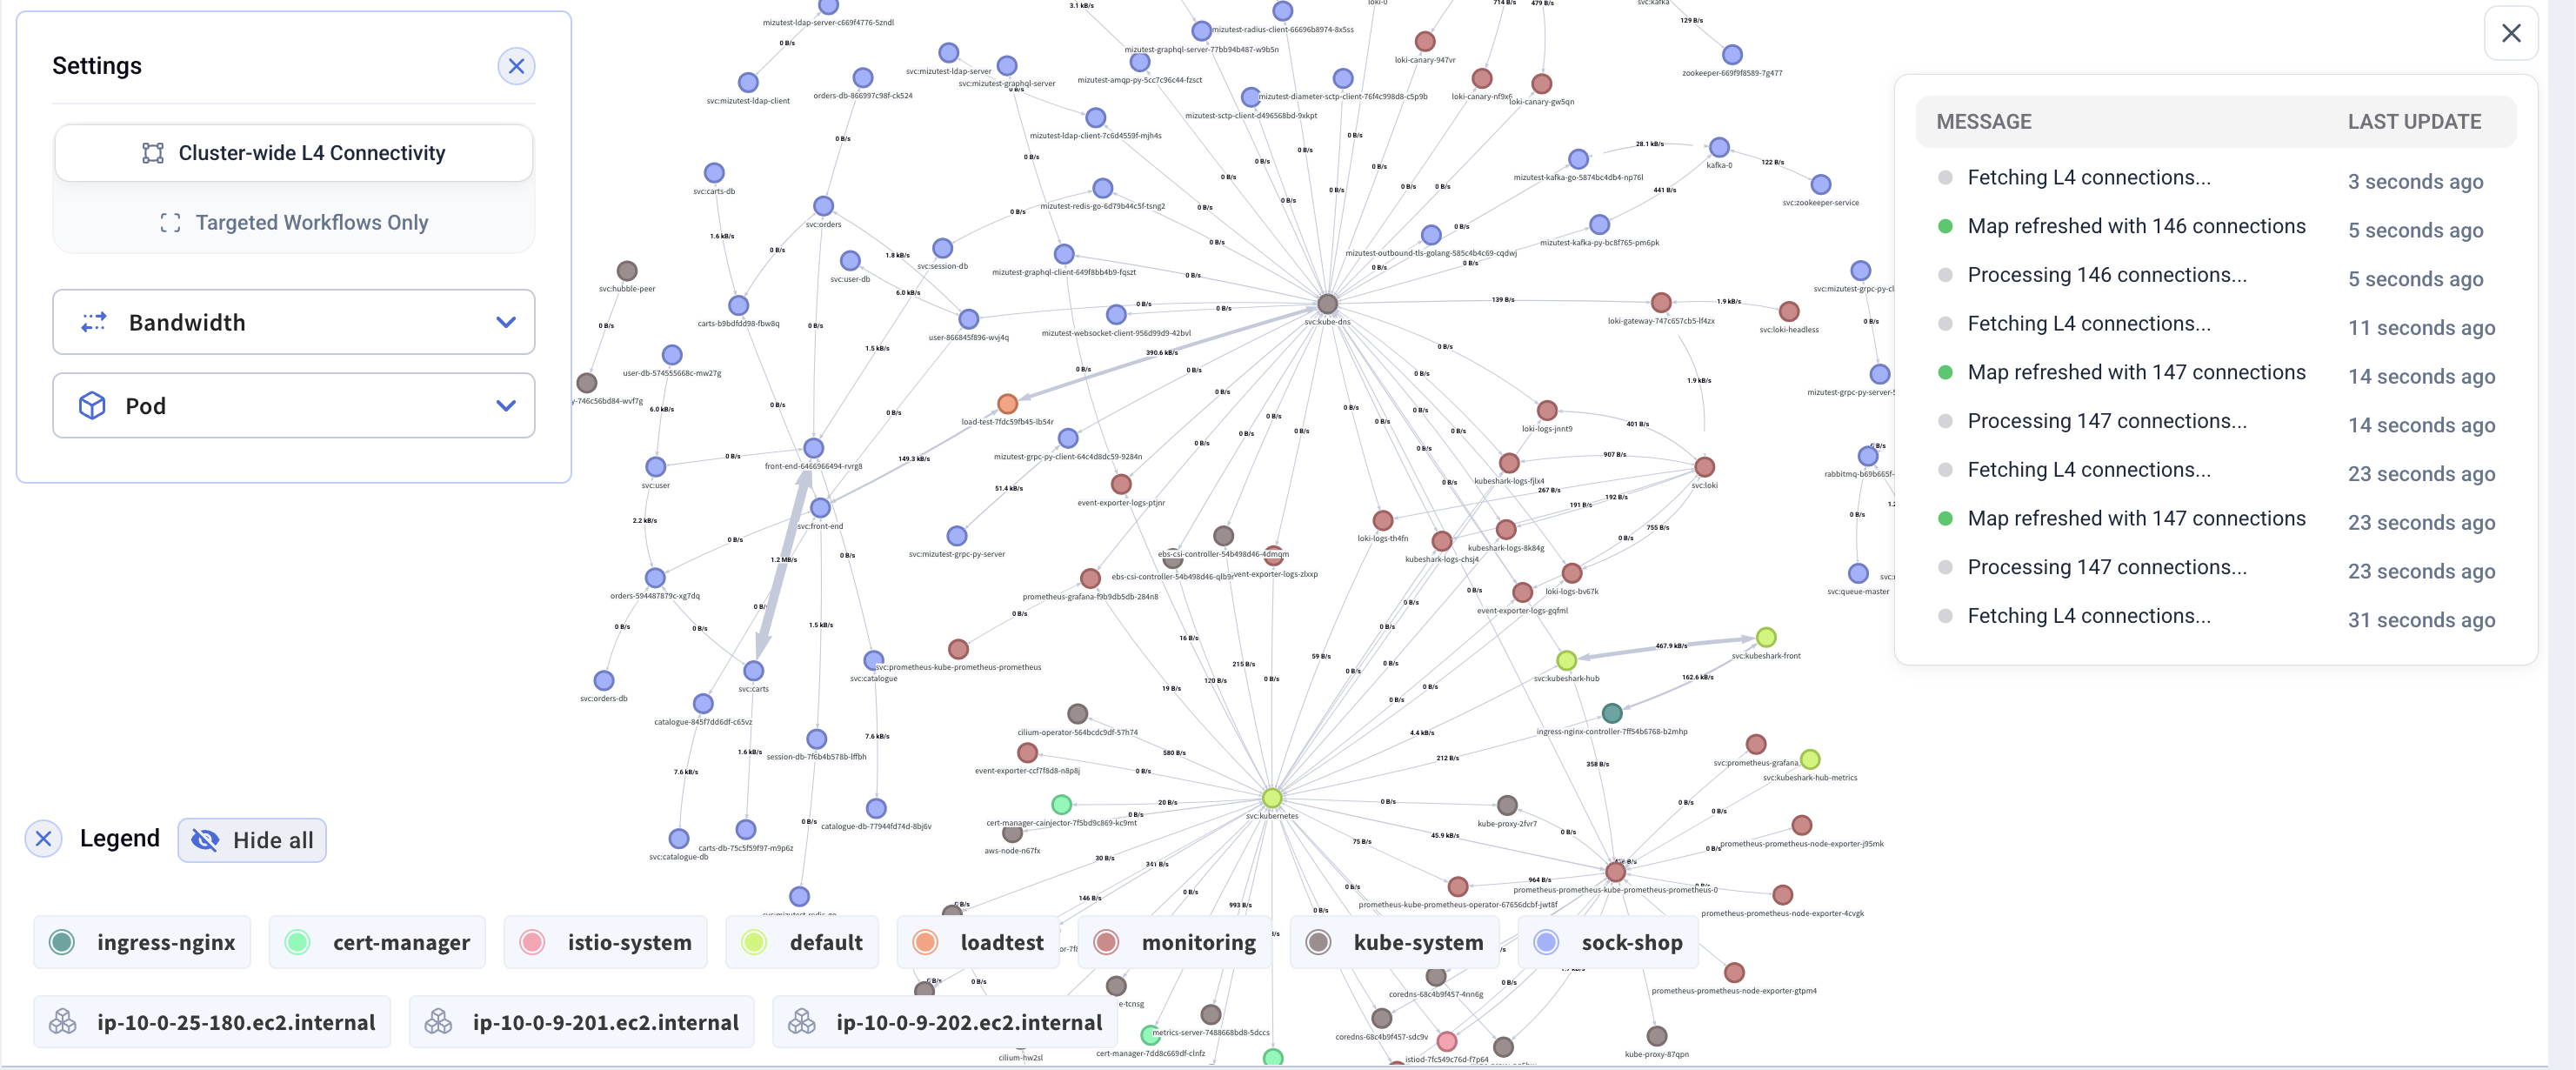
Service Communication Map
The L4/L7 workload map builds a real-time topology graph from observed traffic. It shows:
- Which services are communicating and in which direction
- Traffic volume between each pair
- Error rates per connection
- Cross-namespace communication patterns
This is generated from actual traffic, not from configuration or service mesh metadata — it shows what’s really happening, not what’s supposed to happen.
Common Use Cases
Debugging Integration Issues
A developer’s service isn’t behaving as expected when communicating with another team’s service. Instead of comparing documentation with log output:
- Filter traffic to the specific service pair
- Inspect the actual request being sent — are the headers correct? Is the payload formatted properly?
- Inspect the response — what error is actually being returned? Does the response match the API contract?
- If requests are timing out, check L4 Expert Insights — is the initial RTT elevated (network issue) or normal (application issue)? Are there retransmissions or zero-window events?
- Compare a working request with a failing one
Verifying Deployments
After deploying a new version, confirm it’s behaving correctly before promoting to wider rollout:
- Filter traffic to the newly deployed pods
- Watch live requests and verify response formats, status codes, and payloads
- Check that health check and readiness endpoints respond correctly
- Confirm no unexpected error responses
Understanding Service Dependencies
When onboarding to a new codebase or planning a migration, understand how services actually communicate:
- Open the workload map to see the full communication topology
- Filter by namespace or service to focus on a specific area
- Inspect the API contracts in use — what endpoints are called, what data is exchanged
- Identify undocumented dependencies that only appear in real traffic
Monitoring API and Network Health
Watch live traffic to spot issues before they become incidents:
- Elevated error rates on specific endpoints
- Unexpected changes in request patterns or payload sizes
- Services making calls to unexpected destinations
- DNS resolution failures or high latency
- Rising retransmission rates — early warning of network degradation before it impacts application-level metrics
- Zero-window events on specific services — a receiver is falling behind and will soon cause upstream timeouts
- Handshake RTT creep — increasing network latency on specific paths, possibly indicating congestion or infrastructure issues
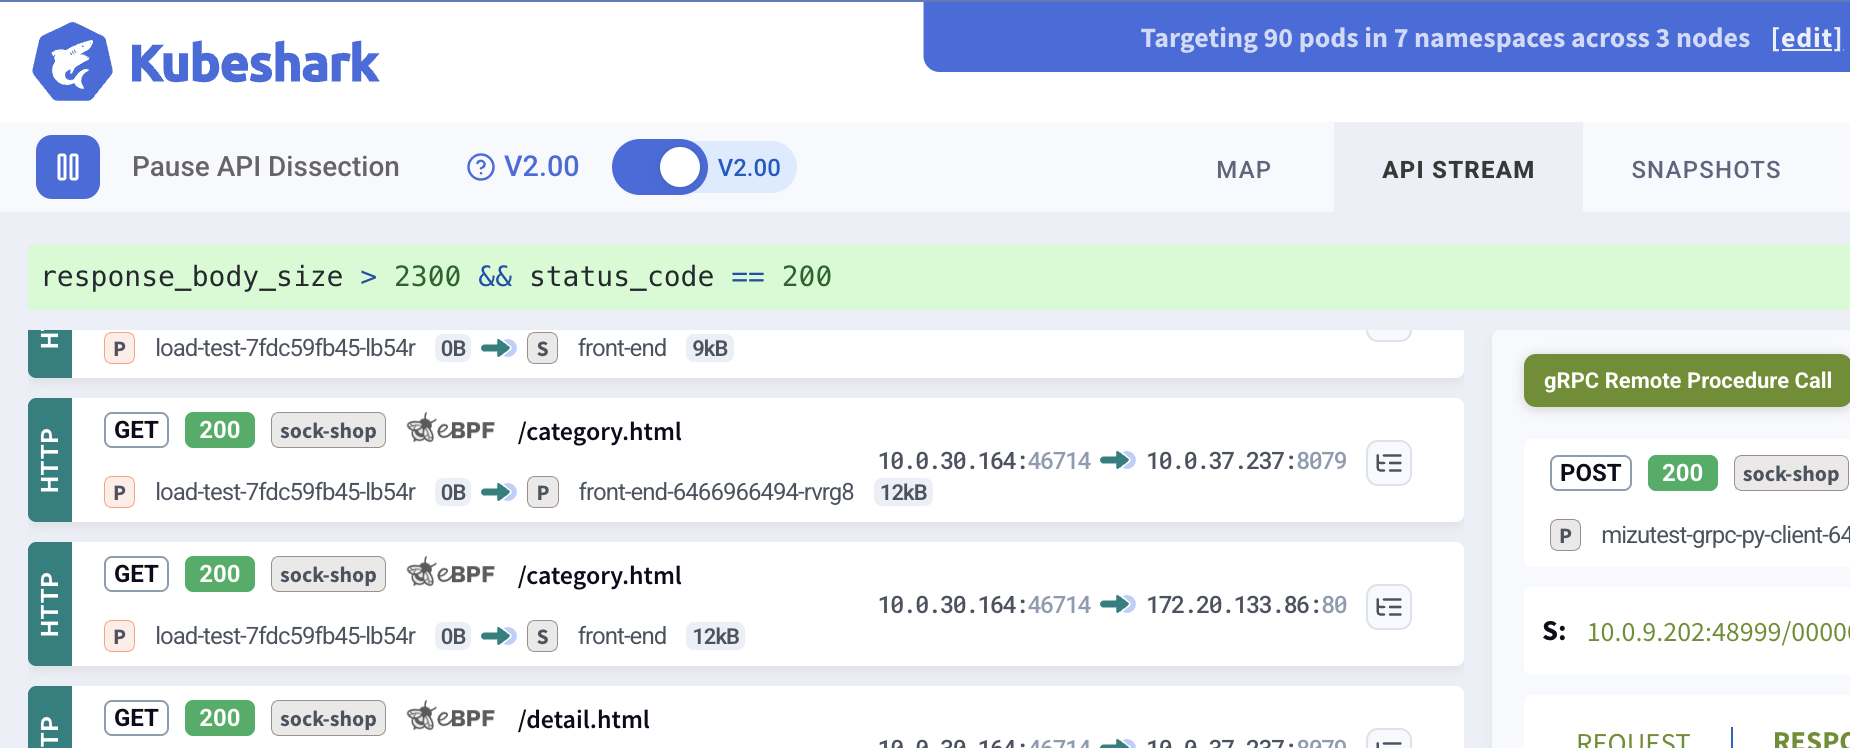
Filtering Live Traffic
Display filters (KFL) let you focus on exactly the traffic that matters:
By service:
src.pod.name.startsWith("frontend") or dst.pod.name.startsWith("frontend")By HTTP status:
http and response.status >= 400By protocol:
grpc and response.status.code != 0By namespace:
src.namespace == "staging" and dst.namespace == "production"Filters apply in real time — as traffic flows through the cluster, only matching conversations appear in the stream.
AI-Assisted Inspection
With AI-powered analysis, real-time inspection becomes conversational. Instead of constructing filters manually, ask questions directly:
“What endpoints is the frontend calling on the API gateway?”
“Show me all failed gRPC calls in the payments namespace”
“Is the order-service receiving any traffic from the mobile backend?”
“What response is the inventory-service returning for the /stock endpoint?”
The AI agent queries live traffic through MCP tools, making real-time inspection accessible to engineers who may not be familiar with packet analysis or filter syntax.
Real-time vs. Forensic Analysis
Real-time inspection and traffic forensics are complementary:
| Real-time Inspection | Forensic Analysis | |
|---|---|---|
| When | Right now, as traffic flows | After the fact, from captured data |
| Purpose | Debug, verify, monitor | Investigate, reconstruct, prove |
| Data source | Live traffic stream | Snapshots of raw capture |
| Best for | Active debugging, deployment verification | Incident investigation, post-mortems |
Best practice: Run both together. Raw capture records continuously in the background, while real-time dissection provides immediate visibility when you need it.
What’s Next
- TCP Expert Insights — Full metric reference, diagnostic decision trees, and interpretation guide
- Real-time Dissection — How real-time L7 protocol parsing works
- Display Filters — KFL syntax for filtering live traffic
- Dashboard — The Kubeshark web interface for real-time inspection
- Incident Response — When real-time turns into an investigation