Prometheus Metrics & Grafana Dashboard
Custom Metrics from Network Information
You can create custom metrics using information gathered from network traffic and export them to Prometheus. Hooks are used to monitor the traffic and can be utilized to create custom metrics. A helper is available to export metrics to Prometheus, typically as part of a scheduled job, ensuring minimal impact on CPU and memory consumption.
Examples of custom metrics:
- Count DNS requests per pod.
- Count status codes per API call.
- Count occurrences of a specific pattern (e.g., when a response field is empty).
Creating a Custom Metric (Best Practice)
It is recommended to create custom metrics using one of the available hooks.
Example:
var dnsCounts = {};

function onItemCaptured(data) {
  if (data.protocol && data.protocol.name === "dns" && data.src && data.src.name) {
    var podName = data.src.name;
    if (!dnsCounts[podName]) {
      dnsCounts[podName] = 0;
    }
    dnsCounts[podName]++;
  }
}
Prometheus Metrics Helper
Kubeshark can export both pre-existing and custom Prometheus metrics. Almost any network-based event can be turned into a custom metric. See below for a list of built-in metrics. A script can also be used to calculate and export custom metrics using the prometheus.metric helper.
Example:
prometheus.metric(
  _metric_name_,          // Metric name
  "Metric description",   // Metric description
  1,                      // Metric type: 1 - Counter, 2 - Gauge, 3 - Untyped (float)
  64,                     // Value
  {                       // Labels
    s_metric: "dnscounts",
    s_pod: podName
  }
);
Exporting Custom Metrics
It is recommended to export custom metrics as part of a scheduled job to ensure efficient resource utilization.
Example:
jobs.schedule("export-metrics", "*/10 * * * * *", function () {
  for (var podName in dnsCounts) {
    prometheus.metric(
      "dnscounts_" + podName,
      "DNS request count per pod",
      1,
      dnsCounts[podName],
      { s_metric: "dnscounts", s_pod: podName }
    );
  }
});
Visualizing in Grafana
Once the script is executed, you can use the following PromQL query to display the custom metric on the Grafana dashboard:
rate({s_metric="dnscounts"}[$__rate_interval])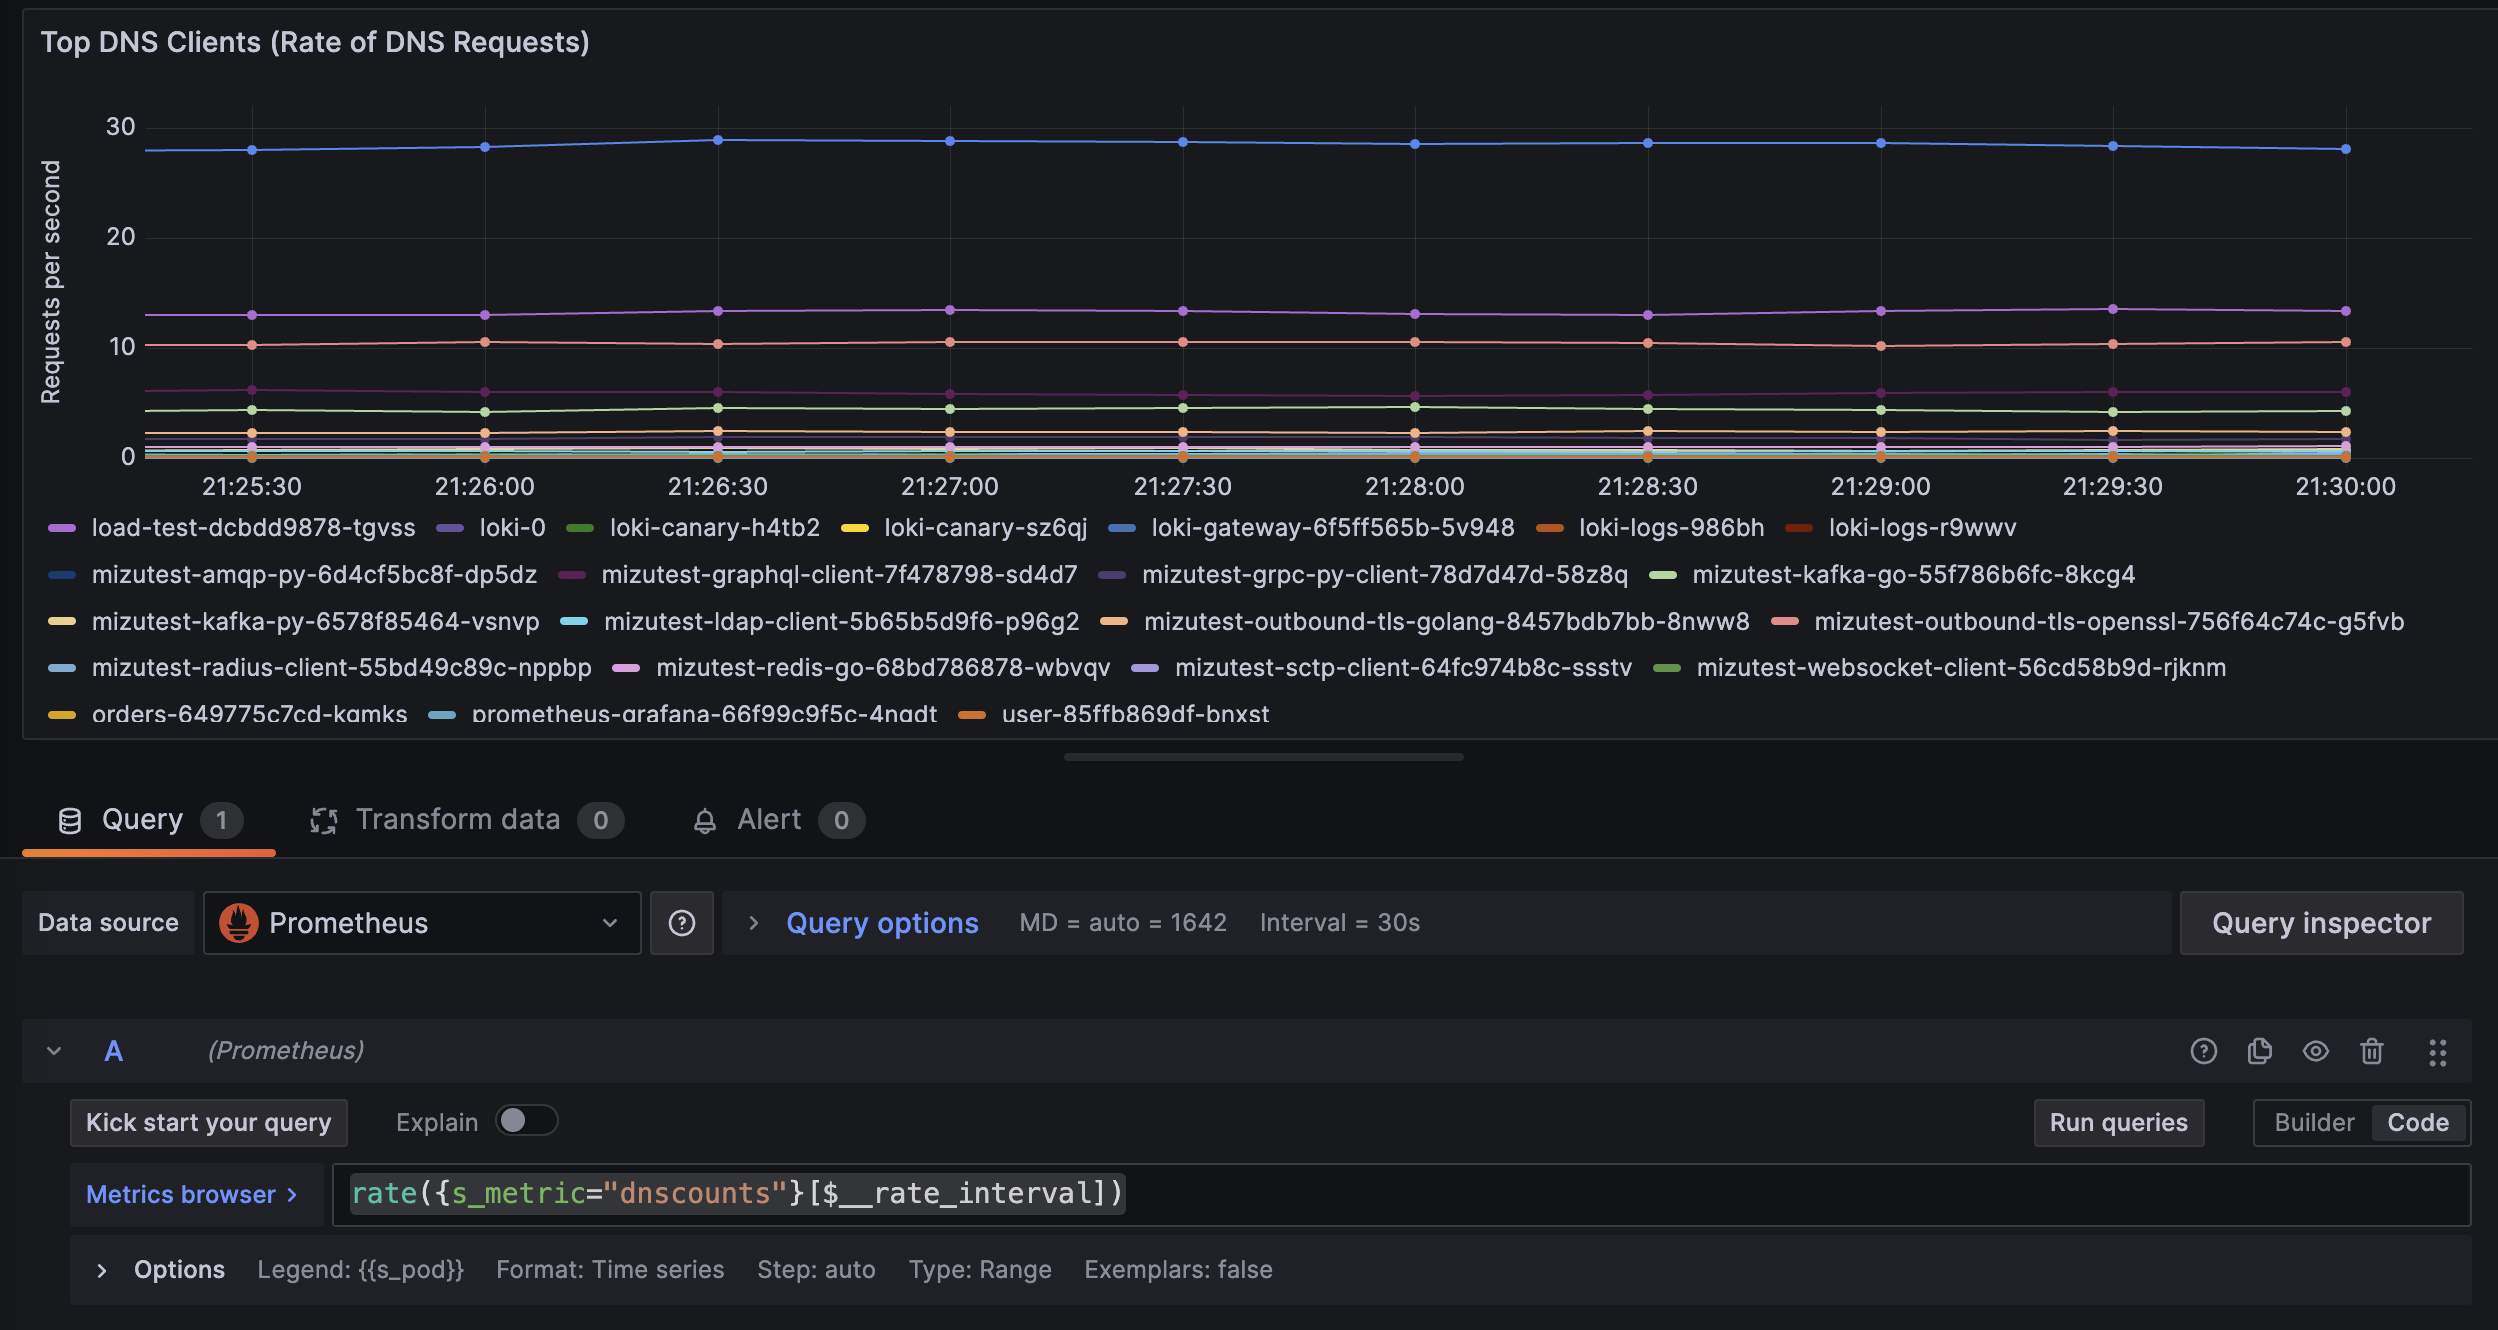
Configuration
Kubeshark exposes metrics from two components:
| Component | Service | Port |
|---|---|---|
| Worker (sniffer) | kubeshark-worker-metrics | 49100, configurable with tap.metrics.port |
| Hub | kubeshark-hub-metrics | 9100 |
Both services carry the prometheus.io/scrape annotation. The scrape configuration below targets the worker service; add an equivalent job for kubeshark-hub-metrics on port 9100 to collect the Hub-side stream metrics.
If you are using the kube-prometheus-stack community Helm chart, you can configure additional scraping for Kubeshark using the following configuration:
prometheus:
  enabled: true
  prometheusSpec:
    additionalScrapeConfigs: |
      - job_name: 'kubeshark-worker-metrics'
        kubernetes_sd_configs:
          - role: endpoints
        relabel_configs:
          - source_labels: [__meta_kubernetes_pod_name]
            target_label: pod
          - source_labels: [__meta_kubernetes_pod_node_name]
            target_label: node
          - source_labels: [__meta_kubernetes_endpoint_port_name]
            action: keep
            regex: ^metrics$
          - source_labels: [__address__, __meta_kubernetes_endpoint_port_number]
            action: replace
            regex: ([^:]+)(?::\d+)?
            replacement: $1:49100
            target_label: __address__
          - action: labelmap
            regex: __meta_kubernetes_service_label_(.+)
Existing Metrics
Existing metrics provide essential insights for monitoring Kubeshark.
For the most up-to-date details, visit the metrics section in the repository.
Capture metrics (worker)
| Name | Type | Description |
|---|---|---|
| kubeshark_received_packets_total | Counter | Total number of packets received |
| kubeshark_dropped_packets_total | Counter | Total number of packets dropped |
| kubeshark_dropped_chunks_total | Counter | Total number of dropped packet chunks |
| kubeshark_processed_bytes_total | Counter | Total number of bytes processed |
| kubeshark_tcp_packets_total | Counter | Total number of TCP packets |
| kubeshark_udp_packets_total | Counter | Total number of UDP packets |
| kubeshark_icmp_packets_total | Counter | Total number of ICMP packets |
| kubeshark_sctp_packets_total | Counter | Total number of SCTP packets |
| kubeshark_tls_packet_count_total | Counter | Total number of received TLS packets |
| kubeshark_tls_packet_dropped_total | Counter | Total number of dropped TLS packets |
| kubeshark_reassembled_tcp_payloads_total | Counter | Total number of reassembled TCP payloads |
| kubeshark_matched_pairs_total | Counter | Total number of matched pairs |
| kubeshark_dropped_tcp_streams_total | Counter | Total number of dropped TCP streams |
| kubeshark_live_tcp_streams | Gauge | Number of live TCP streams |
| kubeshark_item_count | Counter | Total number of items generated |
| kubeshark_ws_write_count | Counter | Total number of items written into WebSockets |
There is no kubeshark_dns_packets_total. DNS traffic is counted as UDP or TCP packets like any other protocol; use a custom metric if you need a per-protocol count.
Capture database metrics (worker)
The capture database holds raw capture on the node. These metrics explain its size and what the prune reclaimed.
| Name | Type | Description |
|---|---|---|
| kubeshark_capture_db_lsm_bytes | Gauge | Size of the capture DB sstables, the stored data the size limit is enforced against |
| kubeshark_capture_db_disk_bytes | Gauge | Total bytes on disk, including the WAL and obsolete tables |
| kubeshark_capture_db_limit_bytes | Gauge | Configured size limit |
| kubeshark_capture_db_open_snapshots | Gauge | Open snapshots. Each pins every version visible when it was taken, so deletions cannot reclaim space while one is held |
| kubeshark_capture_db_open_iterators | Gauge | Open batch iterators. Each holds one snapshot until it is closed |
| kubeshark_capture_db_oldest_iterator_seconds | Gauge | Age of the oldest open iterator, zero if none is open |
| kubeshark_capture_db_last_prune_passes | Gauge | Passes the most recent prune tick completed |
| kubeshark_capture_db_last_prune_keys_removed | Gauge | Keys the most recent prune tick deleted |
| kubeshark_capture_db_last_prune_lsm_freed_bytes | Gauge | Sstable bytes the most recent prune tick reclaimed. Negative when ingest during the tick outweighed what was deleted |
| kubeshark_capture_db_last_prune_stop_reason | Gauge | Why the most recent prune tick stopped: 1 for the reason that applied, 0 for the others |
| kubeshark_capture_db_last_prune_compact_error | Gauge | 1 if a compaction failed during the most recent prune tick, so deletion was recorded but the space was not reclaimed |
| kubeshark_items_stored_in_realtime_db_total | Counter | Base entries written since the process started. Not a count of what the DB currently holds — the prune deletes, and the counter does not persist across restarts |
Streaming metrics
The worker and the Hub both expose a kubeshark_rpc_* family describing the streams that carry
dissected traffic. Worker-side series are labelled by direction, and the per-stream ones also by
stream_name and stream_type.
| Name | Type | Description |
|---|---|---|
| kubeshark_rpc_server_serving | Gauge | Serving state (1 = serving) |
| kubeshark_rpc_server_uptime_seconds | Gauge | Server uptime |
| kubeshark_rpc_active_connections | Gauge | Active connections |
| kubeshark_rpc_total_connections | Counter | Connections since start |
| kubeshark_rpc_stream_calls_total | Counter | Stream calls |
| kubeshark_rpc_stream_calls_active | Gauge | Active stream calls |
| kubeshark_rpc_stream_errors_total | Counter | Stream errors |
| kubeshark_rpc_messages_sent_total | Counter | Messages sent |
| kubeshark_rpc_messages_received_total | Counter | Messages received |
| kubeshark_rpc_messages_dropped_total | Counter | Messages dropped |
| kubeshark_rpc_stream_connected | Gauge | Stream connection state (1 = connected) |
| kubeshark_rpc_stream_buffer_size | Gauge | Current buffer size |
| kubeshark_rpc_stream_buffer_capacity | Gauge | Buffer capacity |
| kubeshark_rpc_stream_buffer_utilization | Gauge | Buffer utilization, 0.0–1.0 |
| kubeshark_rpc_stream_connection_errors_total | Counter | Connection errors |
| kubeshark_rpc_stream_send_errors_total | Counter | Send errors |
| kubeshark_rpc_stream_receive_errors_total | Counter | Receive errors |
Buffer utilization approaching 1.0 alongside a rising kubeshark_rpc_messages_dropped_total is
the signal that live traffic is being dropped before it reaches the dashboard. See
Dropped live traffic.
The Hub additionally exposes kubeshark_rpc_connection_state,
kubeshark_rpc_connection_uptime_seconds and kubeshark_rpc_connection_errors_total for its
worker connections, and a kubeshark_rpc_front_* family — connections_active,
connections_total, messages_sent_total, messages_dropped_total, stream_calls_active,
stream_calls_total, stream_errors_total and stream_buffer_utilization — for the dashboard
streams it serves.
Ready-to-use Dashboard
You can import a ready-to-use dashboard from Grafana’s Dashboards Portal.
TL;DR
Metric
A time-series data stream identified by a name and a set of key-value pairs (called labels). Supported metric types:
- Counter: A cumulative value that only increases (e.g., number of requests).
- Gauge: A value that can increase or decrease (e.g., memory usage).
- Untyped: A metric that does not strictly conform to the semantics of other metric types and is essentially a floating-point value (float64).
Example of a metric:
http_requests_total{method="POST", handler="/api"}http_requests_totalis the metric name.{method="POST", handler="/api"}are the labels.
Install Prometheus Community Version
helm upgrade -i prometheus prometheus-community/kube-prometheus-stack \
--namespace prometheus --create-namespace \
-f kube_prometheus_stack.yaml

kubectl port-forward -n prometheus svc/prometheus-grafana 8080:80
Example kube_prometheus_stack.yaml file:
grafana:
  additionalDataSources: []
prometheus:
  prometheusSpec:
    scrapeInterval: 10s
    evaluationInterval: 30s
    additionalScrapeConfigs: |
      - job_name: 'kubeshark-worker-metrics'
        kubernetes_sd_configs:
          - role: endpoints
        relabel_configs:
          - source_labels: [__meta_kubernetes_pod_name]
            target_label: pod
          - source_labels: [__meta_kubernetes_pod_node_name]
            target_label: node
          - source_labels: [__meta_kubernetes_endpoint_port_name]
            action: keep
            regex: ^metrics$
          - source_labels: [__address__, __meta_kubernetes_endpoint_port_number]
            action: replace
            regex: ([^:]+)(?::\d+)?
            replacement: $1:49100
            target_label: __address__
          - action: labelmap
            regex: __meta_kubernetes_service_label_(.+)